In my previous post, Generation, Capacity and Load Factors, I noted that the data appeared to support the interpretation that CCGT (Combined Cycle Gas Turbine) generation was obliged to ramp up and down in response to the prevailing generation from non-thermal renewables, essentially wind power. In this post I consolidate this conclusion by looking at the evidence from very detailed generation statistics, namely every 30 minutes over a full year (1 October 2021 to 30 September 2022).
In that last article I also raised a key question: could the installed capacity of non-thermal renewables ever be enough to meet all the UK’s electricity demand at all times? Wind power generation currently accounts for 77% of all non-thermal renewable generation. So I change the question to: could the installed capacity of wind turbines ever be enough to meet all the UK’s electricity demand at all times?
Naively one could make the mistake of imagining that, as wind power currently delivers about 22% of the UK’s electricity annually, surely if we increased the installed capacity by (say) five times, wind would then be able to supply all our electricity. I’m afraid I’m offering no prizes for spotting the fallacy in that claim. However large the installed wind capacity, wind will not meet 100% of demand, or indeed any at all, if there is a flat calm over the whole of the UK (including offshore locations).
My question, then, does not relate to installed capacity so much as it relates to weather, specifically the inevitable variability of wind. However, the fact that it is our common experience that there is negligible wind on occasion does not quite prove the point. The reason is that it might be argued that a flat calm in southern England might be compensated by strong winds in the highlands of Scotland or in offshore locations, or vice versa. A devil’s advocate (or, rather, a wind power advocate) might claim that such compensation will always occur. The claim might be that, given enough wind farms across the whole of the UK and its offshore locations, there would always be sufficient generation from some part of the nation to meet 100% of demand. (I’m skirting over any difficulties in transmission under such circumstances).
One feels immediately sceptical, if only because dominant weather patterns are anti-cyclones which sweep across the country from the Atlantic – and whose spatial size usually engulfs the whole of the UK, thus creating strong correlations in weather (and wind) across the nation. However, one need not get bogged down in arcane and difficult arguments about the weather. There is a far better, far simpler, and definitive answer readily at hand. We need just look at the variability of total wind generation that is already installed.
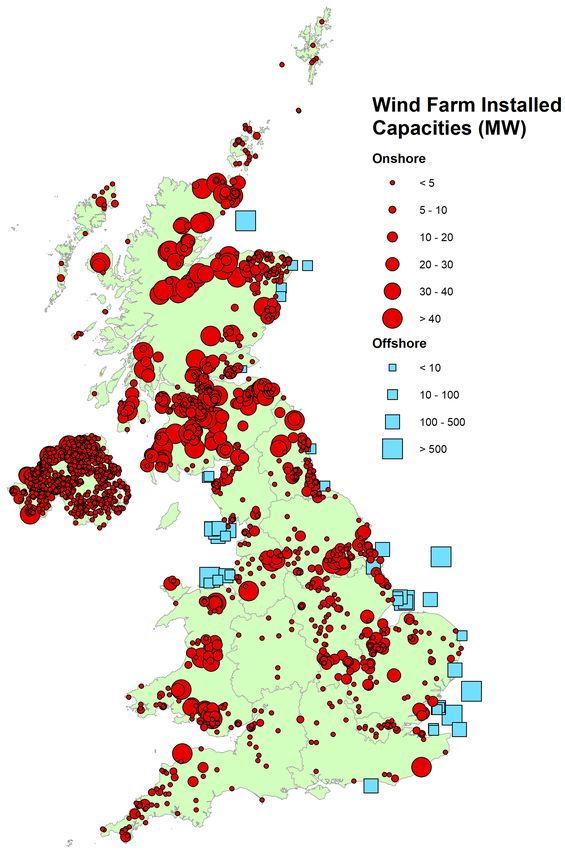
My implicit point is that wind farms are already liberally spread across the whole UK, as illustrated by the map of their locations which heads this post. As this is already the case, if a geographical spread of wind farms was potentially the answer to variability, then this would already be clear from recent generation data. Specifically, if geographical spread opened the way to a 100% wind-based electricity system in the UK, then current total wind generation should already be showing no times when it drops to very low levels.
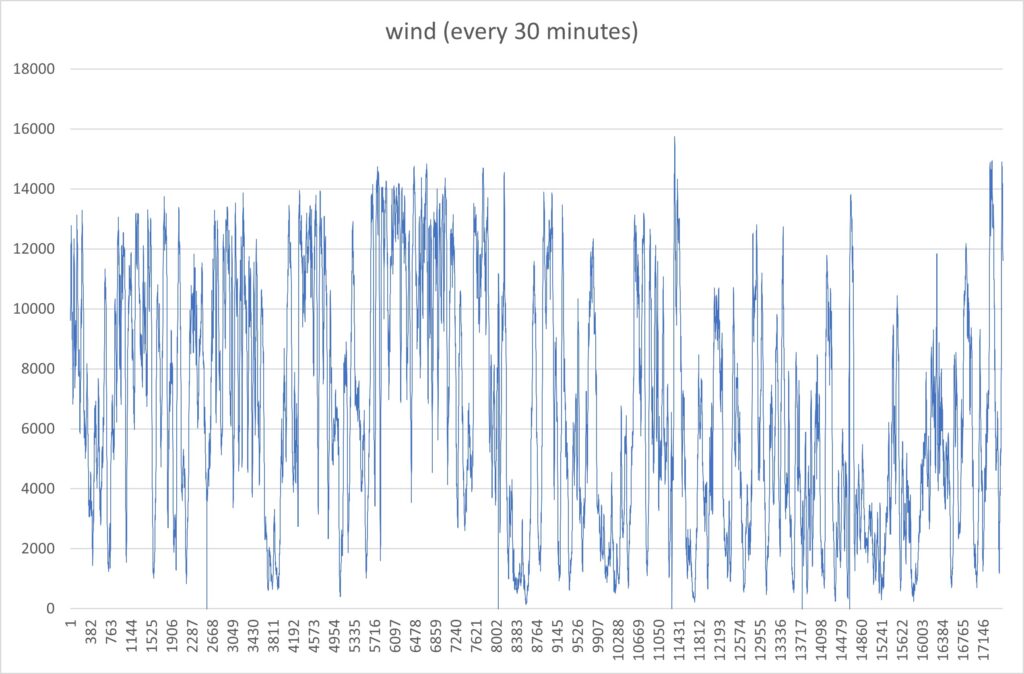
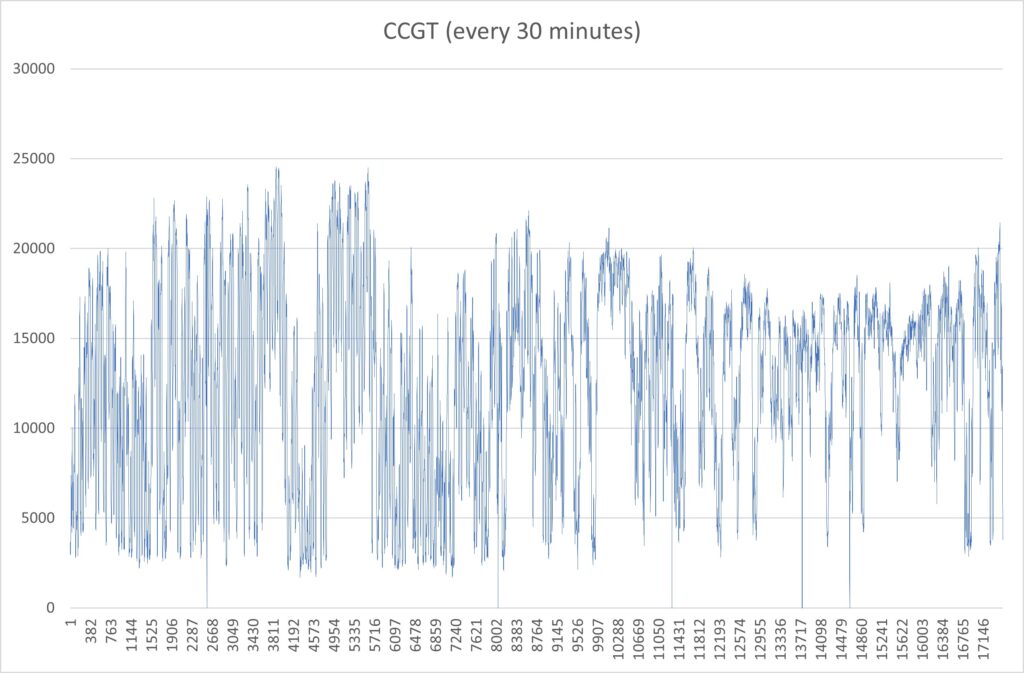
To examine whether that is the case, I consider the generation data at every settlement period (i.e., every 30 minutes) over the last full year, namely 1 October 2021 to 30 September 2022. The data was downloaded from BMRS Elexon. The total power (MW) being generated by wind at half-hour intervals is shown in Figure 1, plotted against settlement period for the whole year. Figure 2 is a randomly sampled period of 31 days. Very obviously the problem of variability has not been defeated by the geographical spread of wind generators.
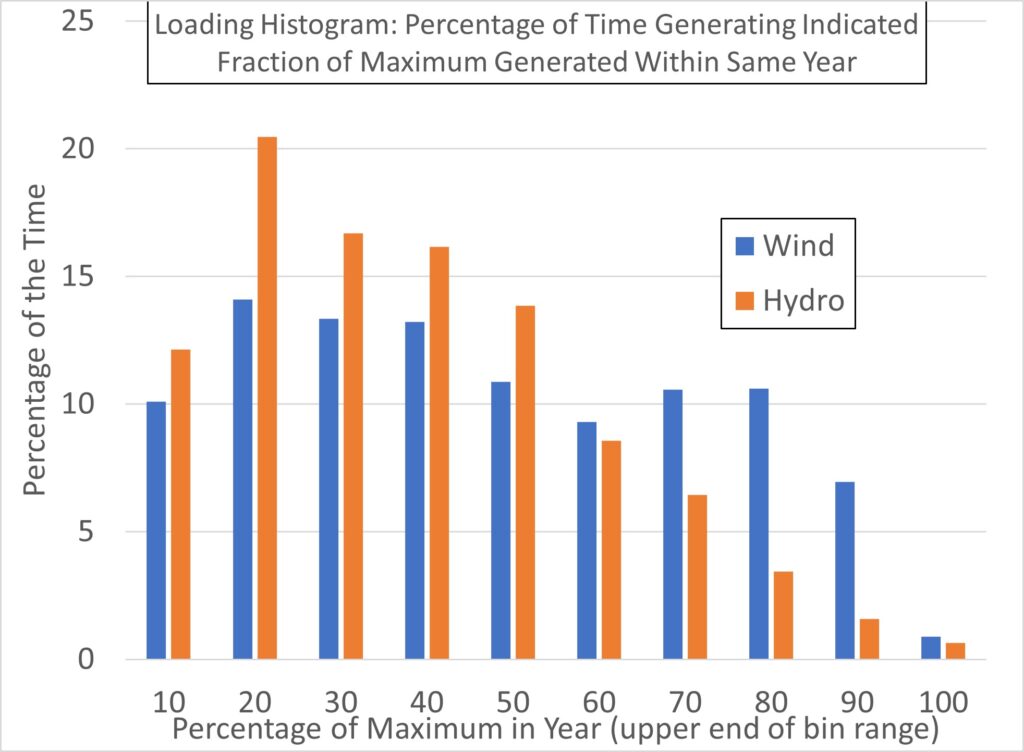
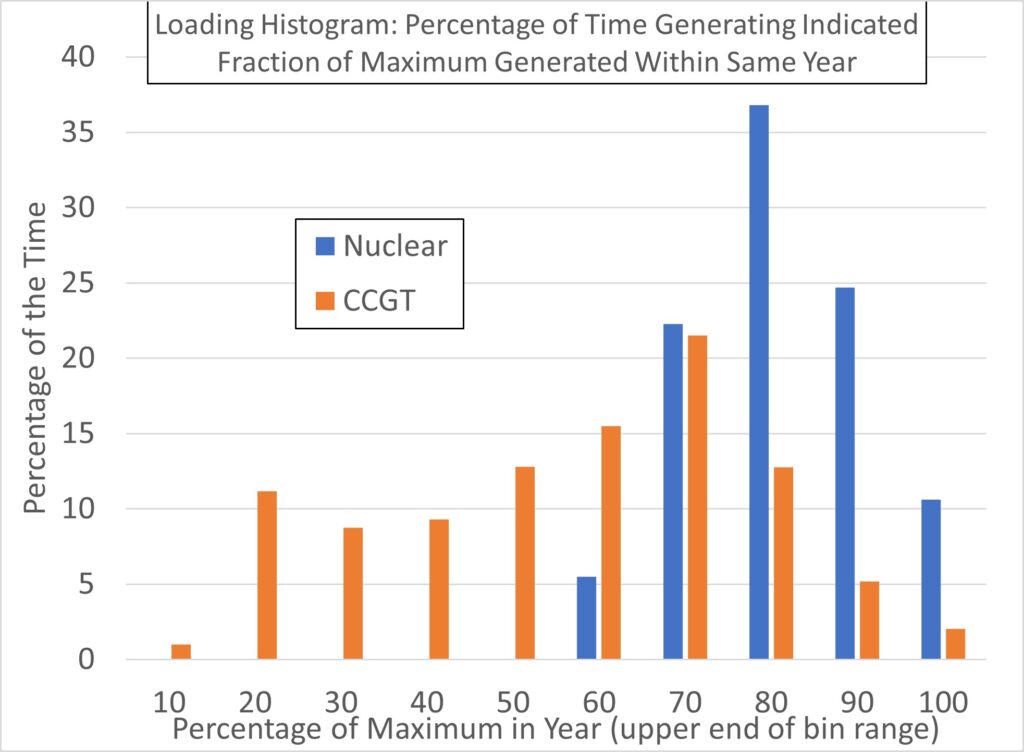
Table 1 shows that both wind and hydro power levels exceed 90% of their maximum in the year less than 1% of the time. They exceed 60% of their maximum only about 29% and 12% of the time respectively, in contrast to nuclear for which the figures is 94.4%. The full loading histograms for wind, hydro, nuclear and CCGT are given by Figures 3 and 4. As we shall see, the loading histogram for CCGT says more about wind generation than it does about the availability or performance of CCGT plant.
| Percentage of Maximum in Year | Wind | Hydro | Nuclear |
| 90% | 0.9% | 0.6% | 10.6% |
| 80% | 7.8% | 2.2% | 35.3% |
| 70% | 18.5% | 5.6% | 72.1% |
| 60% | 29.0% | 12.1% | 94.4% |
Figure 5 is the equivalent of Figure 1 for CCGT plant, i.e., the total CCGT power (MW) at half-hourly intervals for the whole year. It look very similar to Figure 1 for the simple reason that the very high level of variability in CCGT generation is driven by the need to compensate for the variability in wind generation.
You may wonder how I can assert this with such confidence. The answer lies in looking at the correlation between Figure 1 and Figure 5. The Pearson correlation is -0.63. It is negative because as wind power drops, CCGT power has to increase.
To clarify the significance of this correlation, Table 2 is the complete correlation matrix for the 10 generating sources for which BMRS Elexon provides data. (Oddly, that site does not give data for photovoltaics, which presumably is within “other”). There are no other negative correlations which are close to being so large. Other than the CCGT-wind correlation, there are only three which are negative and larger than 0.1 in magnitude, the largest being -0.29, and one of these is the correlation between wind and open cycle gas turbine generation (see in bold in Table 2).
| Oil | Coal | Nuclear | Wind | Pump Store | Hydro | Open cycle GT | Other | Inter- conns | |
| CCGT | 0.01 | 0.41 | -0.05 | –0.63 | 0.33 | 0.13 | 0.35 | 0.45 | -0.18 |
| Oil | 0.01 | -0.01 | 0.00 | 0.00 | 0.01 | 0.03 | 0.02 | 0.00 | |
| Coal | -0.08 | -0.07 | 0.26 | 0.43 | 0.27 | 0.22 | 0.24 | ||
| Nuclear | 0.08 | 0.07 | 0.17 | -0.08 | -0.07 | 0.07 | |||
| Wind | -0.04 | 0.22 | –0.22 | –0.29 | 0.16 | ||||
| Pumped Storage | 0.44 | 0.42 | 0.59 | 0.14 | |||||
| Hydro | 0.17 | 0.20 | 0.53 | ||||||
| Open cycle GT | 0.55 | 0.00 | |||||||
| Other | -0.09 |
Note that any correlation driven by a change in demand would be positive. That is, if sources of generation were all increased to address an increase in demand, then they would be positively correlated.
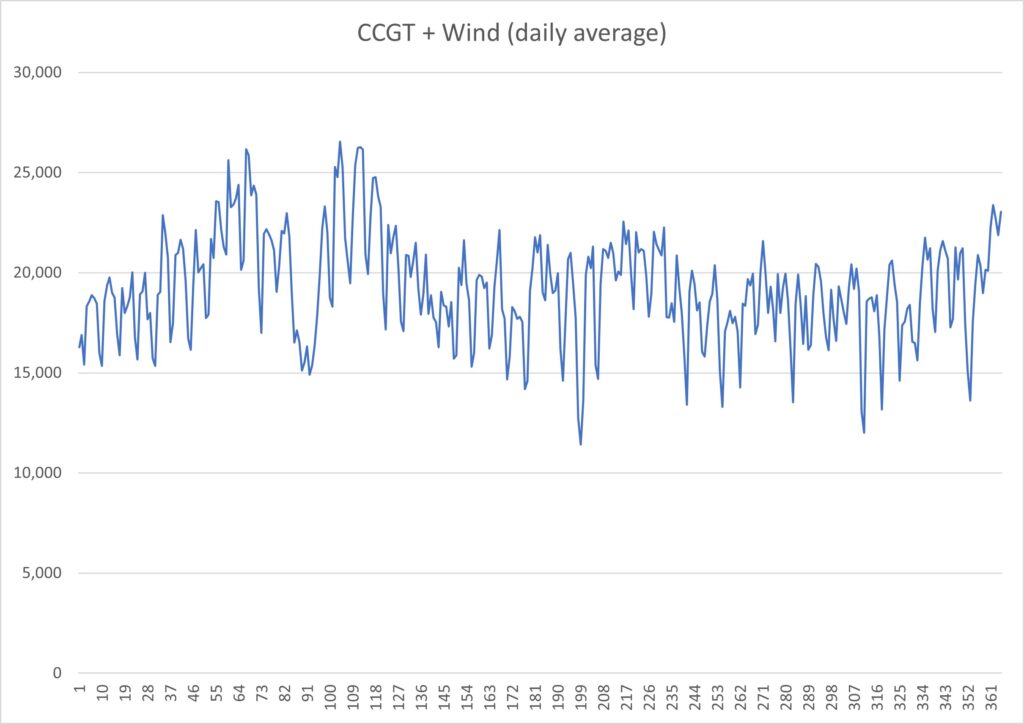
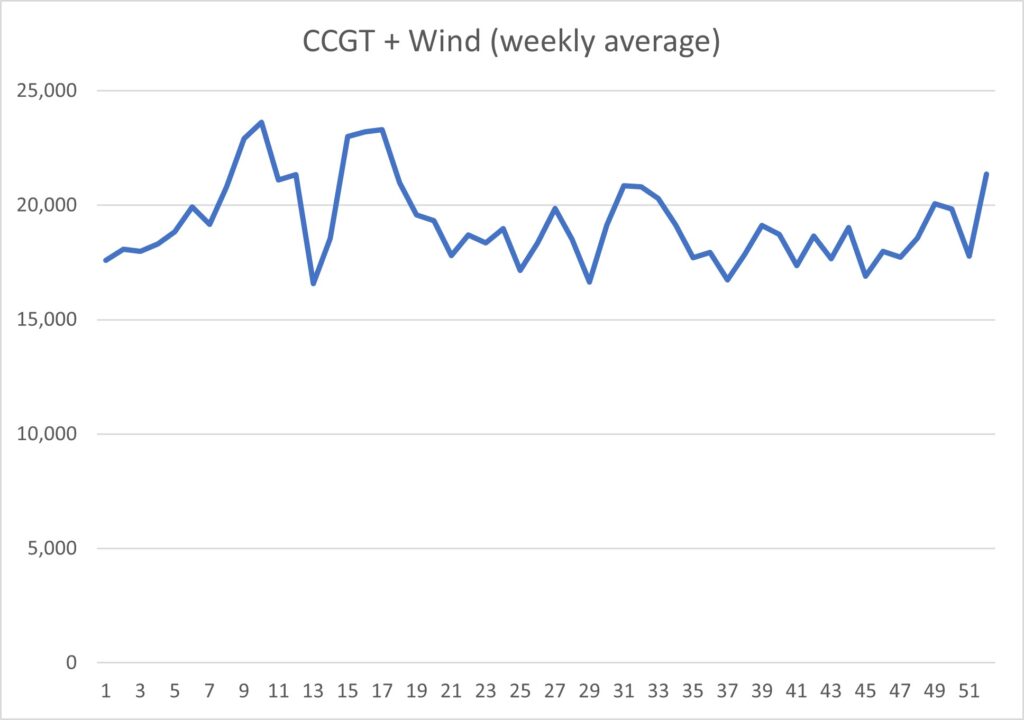
Another way of seeing the clear linkage between CCGT and wind generation is Figure 6 which plots the sum of the daily averaged wind and CCGT power, plotted against day. This has eliminated most of the extreme variability seen in Figures 1 and 5 (because as one source reduces in output, the other increases). If the reason for the short-period ‘waves’ in Figure 6 is not immediately obvious, here’s a hint: there are 52 of them. Yes, demand tends to be different at weekends. That structure disappears when the data is average by week (Figure 7). The uniquely large, negative, correlation between wind and CCGT power persists in these daily or weekly averaged data, namely -0.78.
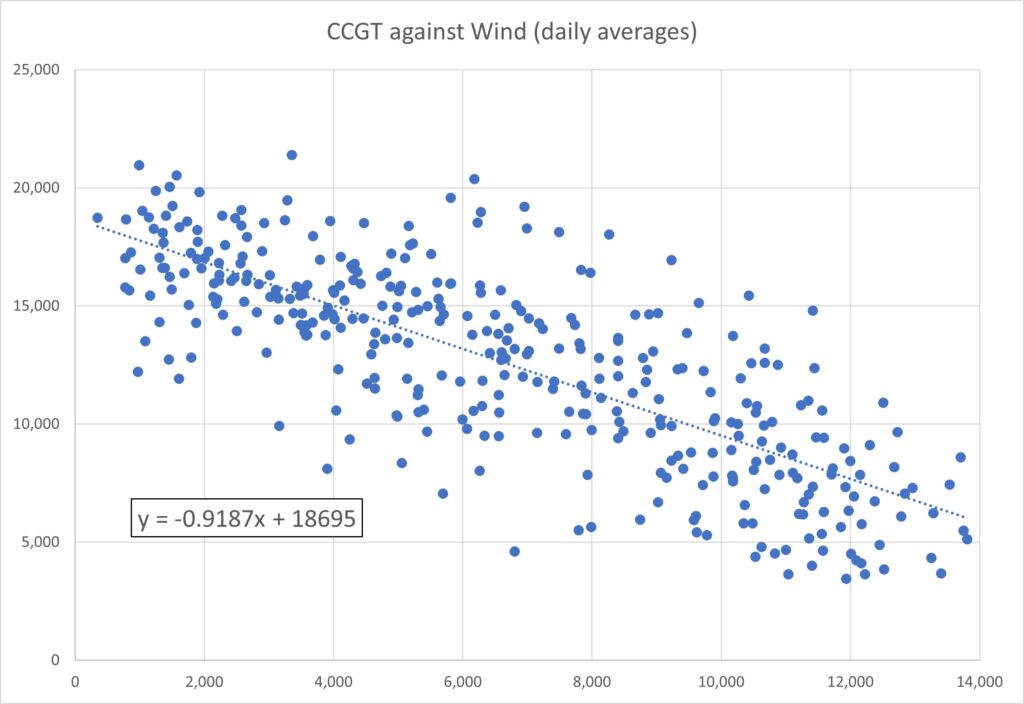
For readers who prefer to see their correlations graphically, this is provided by Figure 8 which plots CCGT power against wind power, using the daily averaged figures. The negative correlation (i.e., the negative slope) is now unambiguously clear. Moreover, the fitted linear trend line (the dashed line whose equation is included on the Figure) shows that there is close to a 1-to-1 correspondence. For every 100 MW increase in wind power there is a 92 MW reduction in CCGT power, on average.
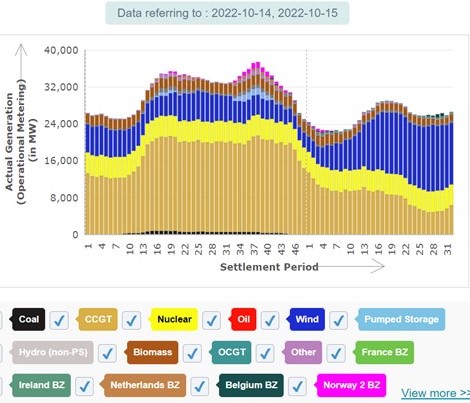
To drive home the message yet again, Figure 9 shows the generation by source on one day of October 2022. It could not be clearer that as wind power increases, CCGT generation is squeezed out.
I rest my case. Wind power can clearly not meet all our demand at all times however much further capacity might be built.
The rapid progress of wind power thus far, in addition to having been made possible at all by the Renewables Obligation, has (by happenchance) been hugely assisted by the post-privatisation dash-for-gas in the 1990s. If it were not for the large installed CCGT capacity it would not have been possible to accommodate so much wind power.
There is more to this than merely having other installed capacity. To accommodate a large proportion of wind power (or other equally variable renewables) there must be stand-by generation which can be brought on-load quickly. Nuclear, in its existing form, will not do. Existing AGR and PWR reactors have inherent problems with being either brought on-load quickly or running at far below their rated power. (I’ll explain why in another post. For those who cannot wait, look up “xenon poisoning”). Pumped storage is ideal for quick response – but there is less than 2.8 GW of it, and this is tiny compared with the variability of the 28 GW of installed wind capacity as shown in Figure 1. Coal isn’t ideal for speed either, as we can see from the very small correlation with wind, Table 2.
Ultimately, then, the tolerable amount of wind generation (or total non-thermal renewable generation) will be throttled by the volume of installed CCGT capacity – and the installed capacity of CCGT has been static for 12 years and is unlikely to pick up because the market conditions are so adverse (deliberately).
Amazingly, there appears to be no recognition of this little problem in the Government’s net-zero strategy (or perhaps you are not so amazed?). The Government’s Ten Point Plan, and subsequent updated commentaries, make no mention of it. Instead they appear to pin their hopes on a massive 40 GW of additional offshore wind capacity by 2030. With a total of 68 GW of installed wind capacity there would indeed be times when 100% of demand could be met from wind. And then, an hour or two later when the wind drops…there will be insufficient other generating plant able to pick up the slack sufficiently quicky.
To avoid this scenario, i.e., the lights going out when the wind drops, there has to be sufficient quick-to-run-up generation available to match a very large loss of wind power.
The only one of the ten points of the plan that could ultimately provide a solution is the development of SMRs and AMRs (small modular and advanced modular reactors). But I can guarantee there will be none of those by 2030, so the plan makes no sense.
Incidentally, the reason why SMRs or AMRs might ultimately provide a solution (on a timescale beyond 2030) is that they hold out the promise of being able to load-follow over a large power range, unlike existing nuclear power stations. Some SMR designs claim to be able to do so, e.g., NuScale. Other designs of SMR, and even more so some designs of high temperature AMR, could solve the problem differently. They would be linked to an industrial process producing hydrogen. Hence, such plant would run continuously at full power, which is the best option for nuclear generation, but when their power was not required by the grid it would be used instead to drive the hydrogen plant. This could be a neat solution, but it requires that a hydrogen economy grows in parallel with it. Moreover, to say these new reactor types have not yet got off the drawing board is an exaggeration of their current state of preparedness: they are not yet even fully on the drawing board.
And yet, if net zero is the target in electricity generation (and perhaps it should not be) then nuclear is the only feasible option to double-up with wind and other variable renewables. The conclusion is that net zero is unachievable in the politically declared timescale. It would be achievable only on the timescale of designing, proving, building and commissioning of novel nuclear plant. No amount of catch phrases like “build back better” or “build back greener” is going to change that.

One response to “Could Wind Power Alone Be Enough?”
Excellent work in terms of analysing the factors affecting generation and load. Unfortunately, you have not considered a key element of electricity supply, and that is frequency. The UK has an integrated 3 phase electricity distribution system. So, the frequency (50 Hz) and phase relationships between the 3 phases (Brown, Black, Grey – 120 degrees) are basically the same everywhere in the UK. If they weren’t, long distance transmission could not work and the network would degrade into self contained islands of generation and usage. Frequency is maintained by the big base load power stations which have thousands of tonnes of spinning mass in turbines and generators all locked together electrically. Smaller generators synchronise with the large ones to maintain system integrity.
So, wind and solar are useful contributors but frequency is also important and must be maintained by the base load generators. I know this is a gross simplification and I apologise to any real distribution network engineers out there who will have forgotten more than I will ever know.