In this post I present data on the installed capacity of electricity generation in the UK, by broad type of source / fuel, and how this has varied dramatically over recent decades.
I also present data on the Load Factors of these generation sources, again by broad source / fuel types. The Load Factor is the amount of generation in a given period divided by the maximum that could have been generated if the plant had run at the declared maximum capacity continuously for the whole period.
The one thing that everyone knows about renewable generation is that the wind does not always blow and the sun does not always shine. Inevitably this impacts on the Load Factor for wind and solar generators.
One of the issues I wish to draw out in this post is how the rise of renewable generation has impacted on the Load Factor of other generators, especially CCGT (Combined Cycle Gas Turbine) stations. A following post will look at the detailed interplay between renewable and gas generation.
In my article Subsidies to Renewables: Who Pays and How Much? I discussed the subsidies which renewable generators receive. But there is a further financial cost associated with the rise of renewables which is additional to these subsidies and generally goes unacknowledged. It arises from the woeful Load Factors of renewable generators, and the consequent need to have other plant always available. This is the underlying theme of this post and the next.
I use the following sources of data,
Ref.1: Historical electricity data: 1920 to 2021. This provides electricity generated (strictly, “supplied”) against year.
Ref.2: Energy Trends, Renewables Data. This has annual data for installed capacities, generation and Load Factors from 2010, broken down by renewable type.
Ref.3: Plant Capacity, UK (DUKES 5.7) with the strapline: “This spreadsheet forms part of the National Statistics publication Digest of UK Energy Statistics (DUKES) produced by the Department for Business, Energy and Industrial Strategy (BEIS)”. It is Table 5.7 on the linked page which I have used.
I will also cite this,
Ref.4: Electricity statistics: Technical information & methodologies.
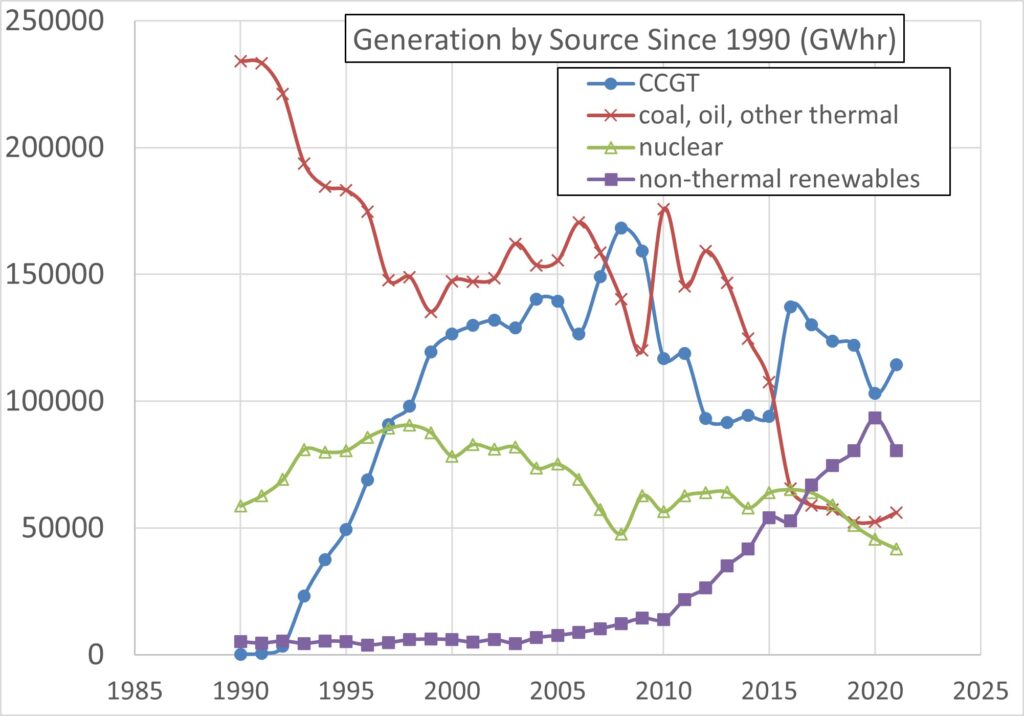
Figure 1, based on data from Ref.1, plots the generation supplied by source type from 1990 to 2021, in GWhr. The line for coal and oil also includes open circuit gas turbine generation and thermal generation from renewable sources, e.g., biomass and gas derived from landfill, sewage, etc. Note that open circuit gas generation was always very small, and remains a tiny proportion of gas generation, which is dominated by CCGT. The renewables line is for non-thermal renewables only, i.e., wind, solar and natural-flow hydro. Pumped storage is not included in the Figure (it does not represent any net generation).
Figure 1 shows how CCGT generation took off very quickly after privatisation of non-nuclear generation in 1990. It also shows how non-thermal renewable generation took off only after the Renewables Obligation (RO) was instigated in 2002.
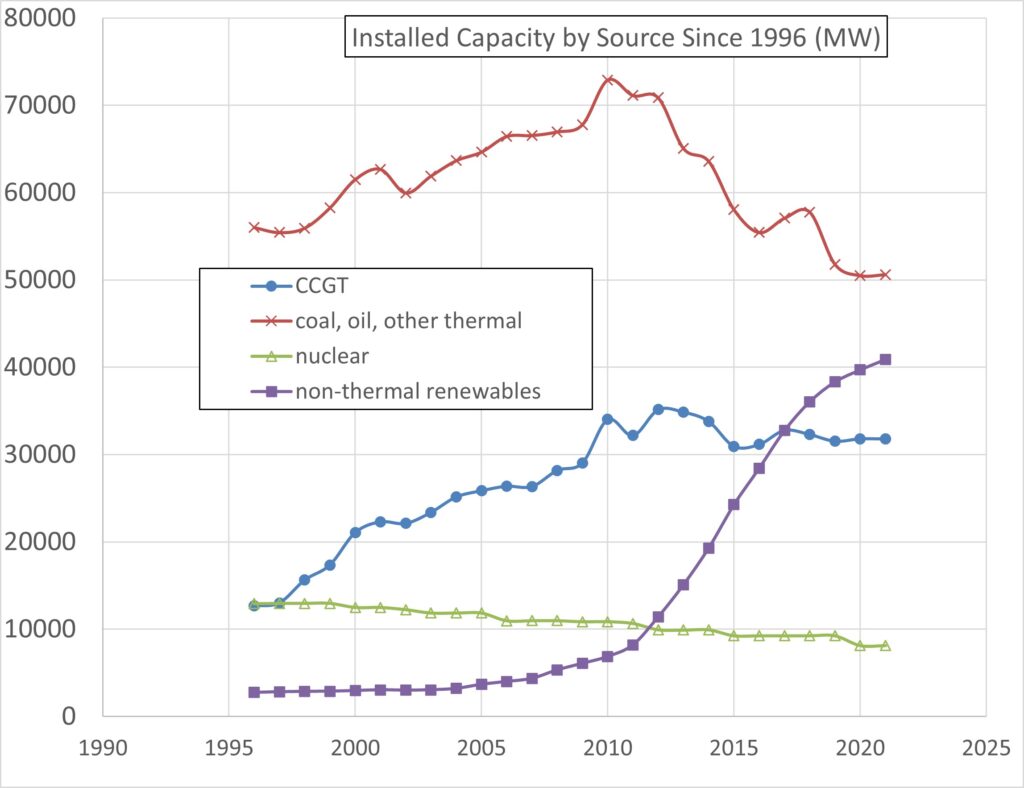
Figure 2 plots installed capacities since 1996 by the same categories of generator type. These data are mostly from Ref.3. However, this source is grossly misleading in the case of non-thermal renewables, for reasons discussed below, so Ref.2 has been used for the latter.
Figure 2 shows the steep rise in installed non-thermal renewable capacity, consistent with Figure 1. It also shows a gradual decline in nuclear installed capacity as nuclear stations have closed, again consistent with diminishing nuclear generation from the mid-90s onwards shown in Figure 1. This latter trend will continue as further nuclear stations have since, and will continue to be, shut down.
Figure 2 also shows how the increase in CCGT installed capacity, which started in the early 90s, was curtailed when non-thermal renewables really took off after 2010. This was, of course, the intention – that renewables would displace fossil fuels, thanks to the RO.
Rather surprisingly, coal, oil and “other thermal” has easily the largest installed capacity (as, indeed, it always did), despite now generating less than 20% of the UK total. I presume existing coal plant must remain available, despite doing little in the way of generation. One wonders if the dust will have to be blown off them this winter.
So, what’s the problem with the non-thermal renewables capacity data from Ref.3? What’s wrong with it is that it isn’t the true installed capacity at all. It has been “adjusted” (fiddled, frankly). Ref.3 states,
“Small-scale hydro, wind and solar photovoltaics capacity are shown on declared net capability basis, and are de-rated to account for intermittency, by factors of 0.365, 0.43 and 0.17 respectively. See section 4.10.2 and 4.10.3 of ‘Electricity statistics: data sources and methodologies’ for details.”
The latter is Ref.4, which states,
“4.10.3 Capacity derating: Derating of capacity reduces the reported capacity figure for types of generation that require particular conditions, particularly wind, hydro and solar generation which are reliant on wind, rainfall and sun. It is done in order to make comparisons with forms of generation that do not have these restrictions. Capacity is derated by applying a scaling factor to the declared net capacity of the generator. These factors are 0.43 for wind, 0.365 for small scale hydro and 0.17 for solar photovoltaics. Further information on this can be found at: www.legislation.gov.uk/uksi/1990/264/made.”
Staggeringly, the imposition of these fiddle-factors is an obligation under that Statutory Instrument! (A Statutory Instrument is a legally mandatory requirement raised unilaterally by a Minister of State who has been conferred powers to do so by primary legislation). Consider, for example, a wind farm with the capacity to deliver 100 MW when wind conditions are ideal. We are obliged, by law, to pretend that it has a capacity of only 43 MW. If it were a PV installation we would have to pretend the engineered capacity of 100 MW was only 17 MW.
It makes very little sense to state such derated capacities because actual wind turbines, for example (and indeed whole wind farms) do generate at close to their true engineered capacities for a certain, if small, proportion of the time. The load-duration curve for the UK’s off-shore wind farms, combined over the last 5 years, shows that they generate in excess of 90% of true capacity for around 4% of the time, but less than 20% of true capacity 30% of the time (see Andrew ZP Smith, ORCID: 0000-0003-3289-2237; “UK offshore wind capacity factors“).
The claim from the BEIS that the use of derated capacity is “done in order to make comparisons with forms of generation” is pretzel logic. Applying derating to one type of generation and not another is a means of making the comparison misleading. It is actually a confusion between capacity and load factor.
Whatever the motivation behind the introduction of derated capacities, it would certainly be grossly misleading to use them in calculating Load Factors. If that were done, the denominator in the definition of Load Factor would be artificially smaller than the true capacity and so the Load Factor calculated would be falsely inflated. But all this would do is sweep under the carpet the fact that the wind does not always blow at the optimal level for generation.
Consequently, I have used the true capacities for all plant.
So, for non-thermal renewables from 2010 onwards I use capacity data from Ref.2. In 2010 this capacity was 1.77 times the derated capacity given in Ref.3. Prior to 2010 I use the derated capacity from Ref.3 multiplied by 1.77.
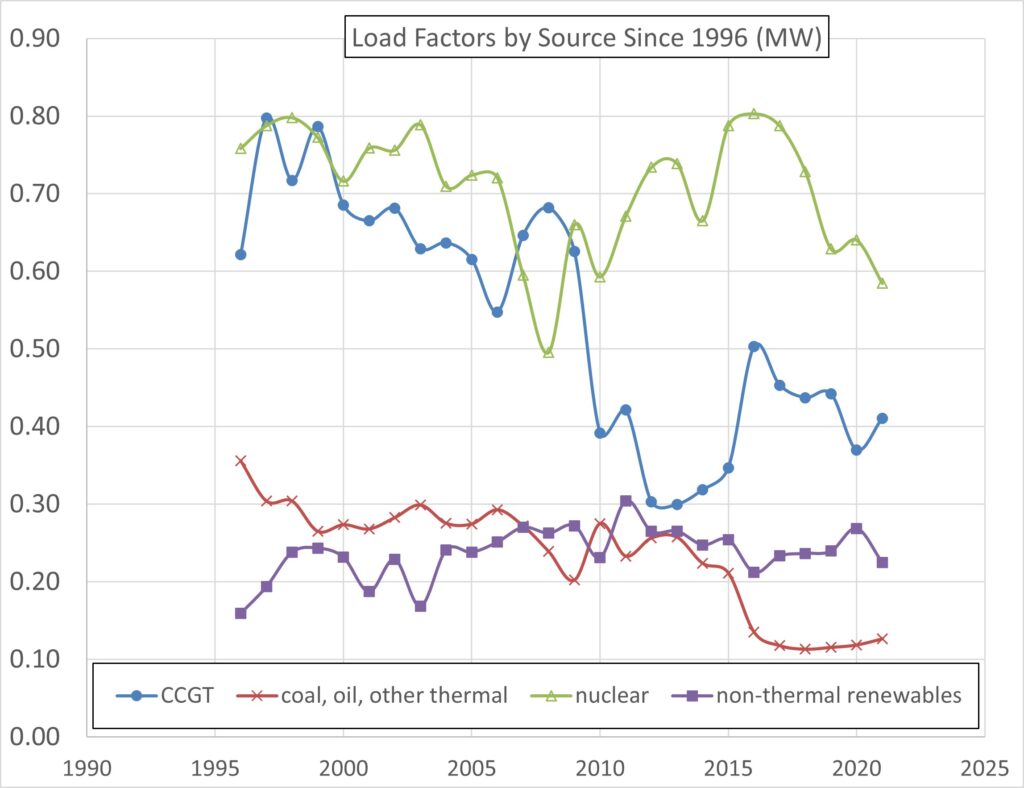
Figure 3 plots the Load Factors against year from 1996 to 2021 for the four broad categories of source: nuclear, CCGT, non-thermal renewables, and conventional thermal (coal, oil and renewable gas sources). For nuclear and non-thermal renewables, the Load Factors represent the performance of the plant. These generators will feed into the grid as much as they can, pretty much all the time. Over the 26 years plotted, the average Load Factor for nuclear was 71% and for non-thermal renewables 24%.
For CCGT and conventional thermal the situation is very different. The Load Factor for conventional thermal (coal, etc) tells you nothing about plant performance. It merely reflects how much this plant is constrained-off. The high level of capacity which is still declared for conventional thermal, together with most of the plant in this category being the least likely to be asked to generate, means that the Load Factor is inevitably woeful. But this just reflects how much such plant is constrained-off.
For CCGT the same applies, and the details are interesting. Between 1996 and 2009, when non-thermal renewables were increasing but still at a modest level, the Load Factor for CCGT fell gradually from around 0.8 to around 0.6 in response to increasing renewable generation. But in 2010 the CCGT Load Factor fell steeply to around 0.4 and stayed at between 0.3 and 0.5 thereafter due to the steep increase in renewable generation after 2010. In other words, the CCGT Load Factor tells you nothing about the availability or potential performance of CCGT plant; instead it tells you about how much renewable generation is available. This is, of course, deliberate. The strategy is to drive out fossil fuels.
If you place priority on reducing carbon dioxide emissions, then this is good news. Whether one should place priority on reducing carbon dioxide emissions is a climate change question which I’ll defer to later discussion in another post (probably many thereof).
What I want to draw to your attention now is the hidden cost of renewables implicit in their driving down the Load Factor of other plant, specifically CCGT though also conventional thermal to some extent. The first thing to emphasise is that this is in no way a market place. The driving down of CCGT by renewables is a manifestation of political will. Most of the renewable plant would not have been built without the subsidies of the Renewable Obligation (RO). Moreover, the RO also strongly encourages (virtually coerces) a certain proportion of generation to be from renewables (and this proportion is now chasing a target of nearly 50%, see my article Subsidies to Renewables).
Suppose you opened a shop but the Government passed a law saying that your shop could only open when a competitor shop down the road was shut. That does not sound like an attractive business proposition. But if the Government also paid the competitor large subsidies to permit it to stay open far longer than it would otherwise have been able to do, that rather sounds like the Government wants to drive your shop out of business. And, of course, that is actually what the Government do want in respect of fossil fuels (net zero).
Fortunately for the owners of CCGT stations (or conventional thermal stations), the weather has scant respect for Government and ensures that the non-thermal renewables have a sufficiently poor Load Factor that there is still a market for the competition. For that reason, will there always be a market for generators ready to take up the slack when the wind is weak and the sun feeble?
The question that arises at this point is whether, with sufficient installed wind capacity, the renewables would reliably be able to meet demand at all times despite their poor Load Factor. But however large the installed wind capacity, it will not meet demand in a flat calm over the whole of the UK. The question, therefore, comes down to: is it always sufficiently windy over a sufficient proportion of the country (including off-shore locations) to meet demand? We shall look at this question in the next post.
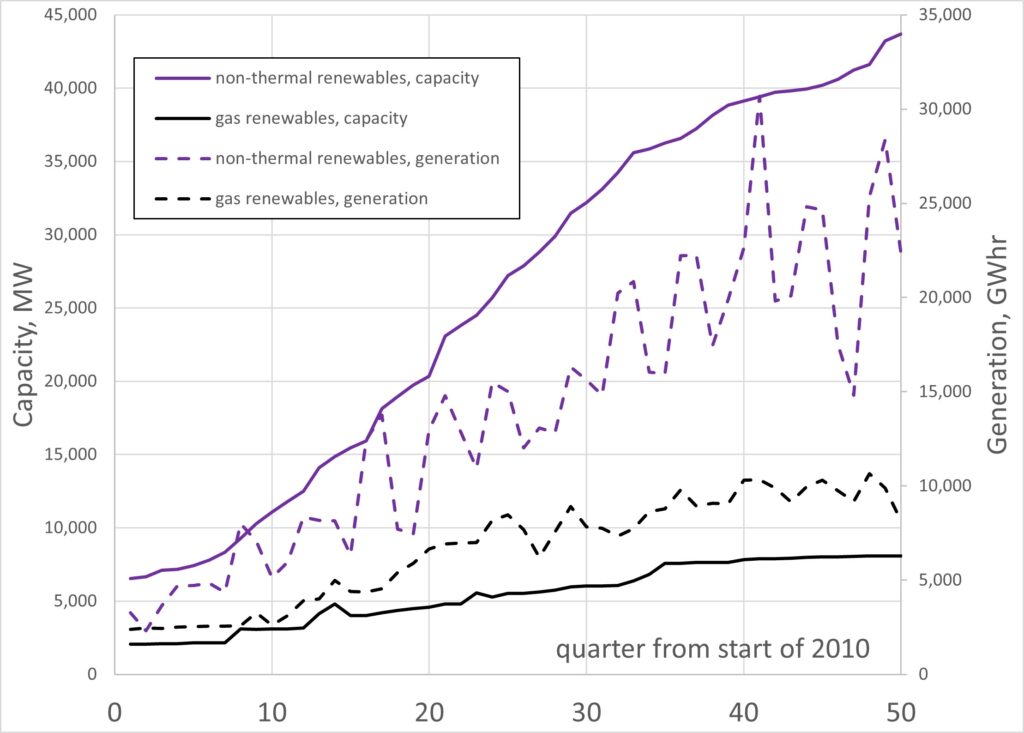
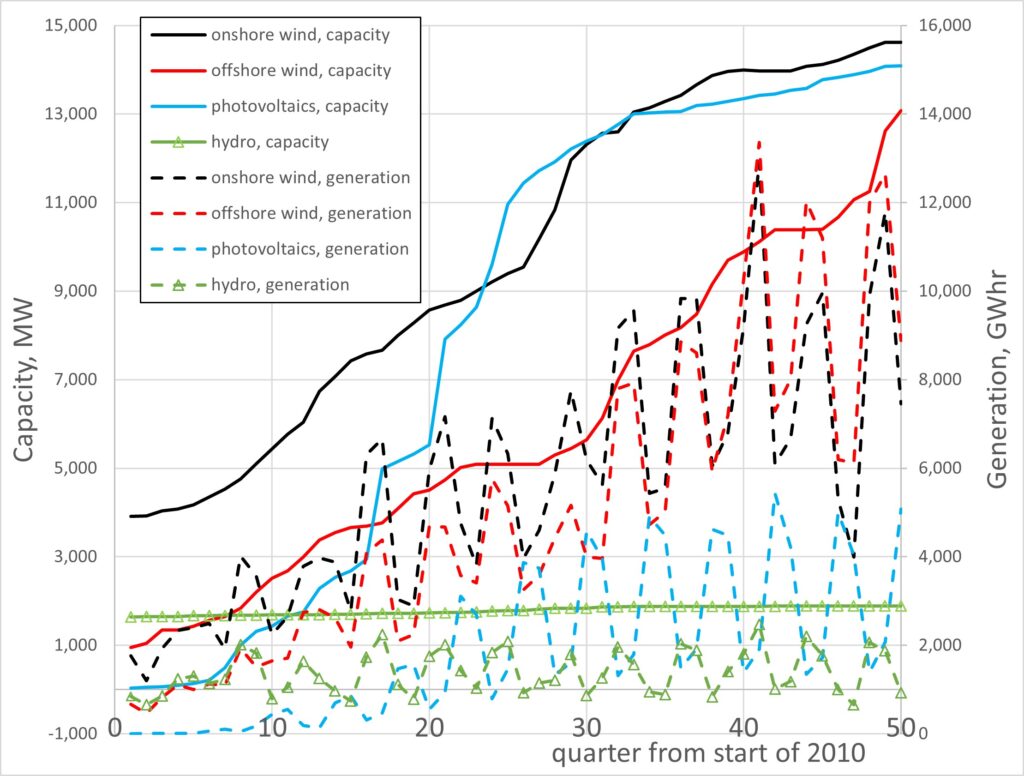
Finally, let’s look at the renewables in more detail. Figure 4 plots the installed capacity (MW) of non-thermal renewables and gas renewables, together with the electricity generated by them (plotted against quarter from the start of 2010 to June 2022). Gas renewables include landfill gas, plant biomass, animal biomass, and energy from sewage, waste and anaerobic digestion. In 2010, landfill gas (~1 GW) dominated this category, but it is now dominated by plant biomass, the largest contributor to which is Drax which burns wood pellets (2.6 GW) having previously been one of the largest coal-fired power stations in Western Europe (then at 4 GW).
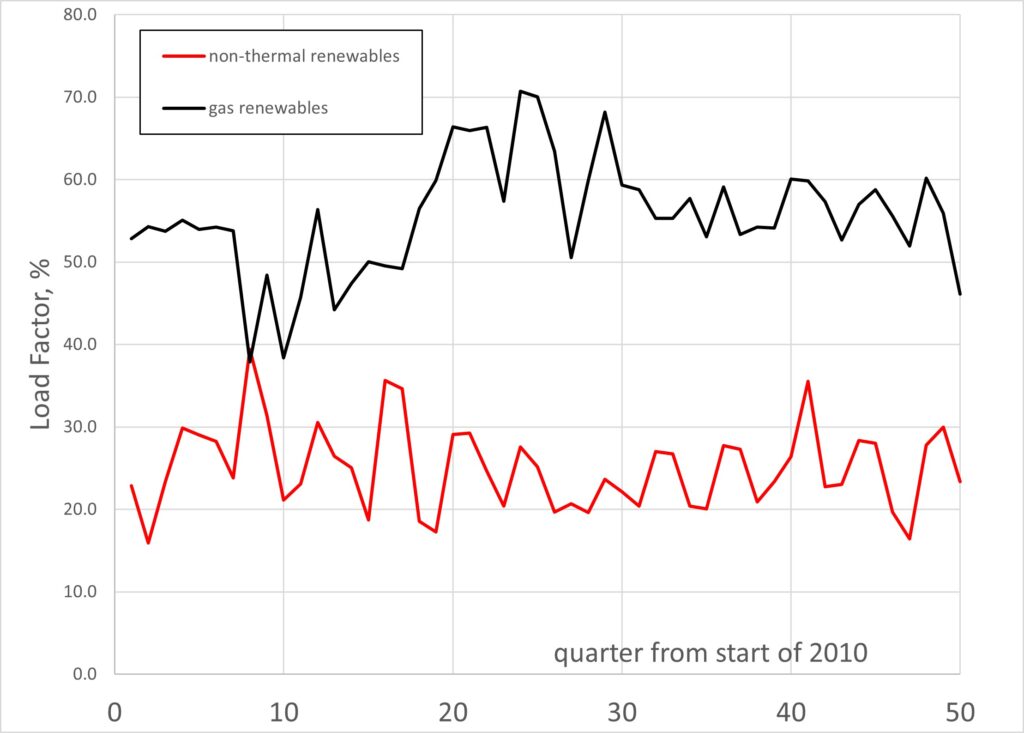
Figure 5 plots the quarterly Load Factors for non-thermal renewables and gas renewables, showing that the latter hugely out-performs the former. Non-thermal renewals have an average Load Factor over this period (2010 to 2022) of 25.0%, compared with 55.5% for gas renewables.
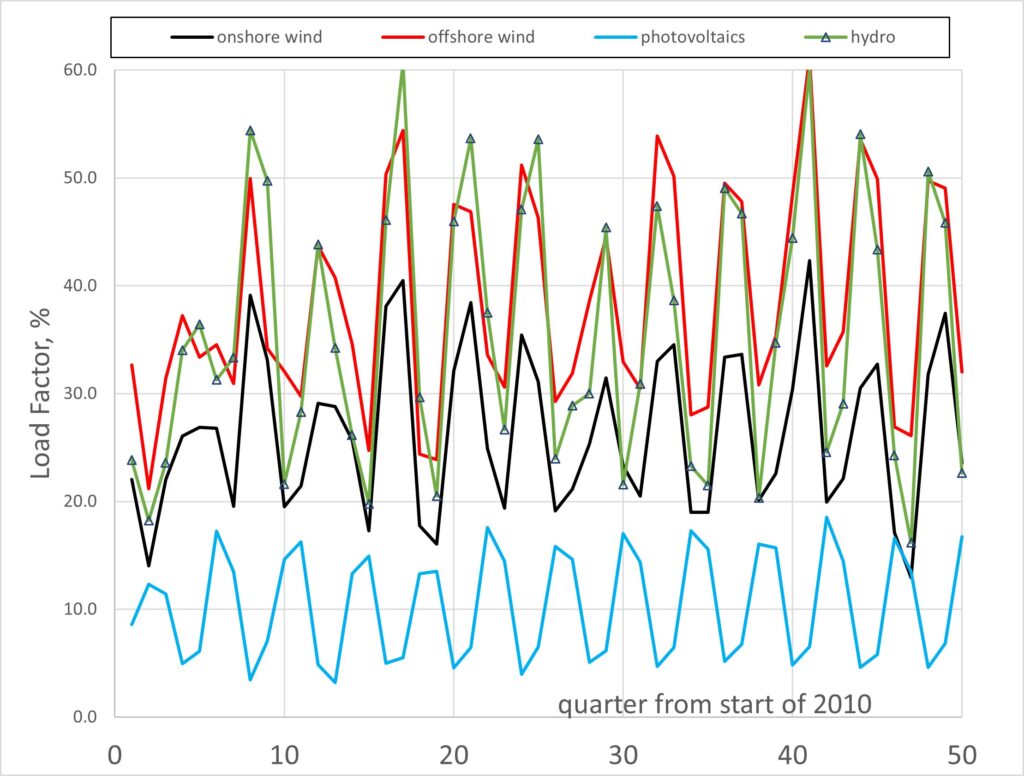
Figure 6 breaks down the non-thermal renewables into onshore wind, offshore wind, photovoltaics and hydro, showing both their capacities and their generation, whilst Figure 7 shows the corresponding Load Factors. The seasonal variation is evident in all these generation types (photovoltaics being greatest in the summer, of course, whilst the other three sources are least in the summer). Over the period 2010 to 2022 the average Load Factors were: onshore wind 26.4%; offshore wind 38.3%; photovoltaics 10.3%; hydro 35.6%.
The above cited Andrew ZP Smith link gives the Load Factor averaged over the 12 months to 31 May 2022 for all UK off-shore wind taken together as 42.2% (or 39.6% over life).
A key point to take away from Figures 5 and 7 is that the mean annual Load Factors of the non-thermal renewables has not improved over the last 12 years, and Figure 3 shows there has been barely much upward trend even over 26 years. This has implications for the key question which will be addressed in the next post: could a large enough installed capacity of non-thermal renewables ever meet 100% of the UK’s electricity demand at all times?