This is a tricky time to be presenting data on the cost of energy to consumers. There were massive hikes in domestic electricity and gas prices in April 2022 and again in October 2022 – initially with a further swinging increase on the cards for April 2023. (Do note, however, that wholesale gas prices, which are driving these changes, had been rising steeply since the start of 2021). These price hikes are so severe that the Government has been obliged to step in and provide subsidies for domestic consumers, with parallel arrangements for businesses. Domestic consumers will be granted a £400 discount as well as a Government-imposed price cap per unit of energy, well below what the unit price would have been without Government intervention.
But that is not what this article is about. What I wish to address are the subsidies to electricity generation from renewable sources which were in place before this latest energy debacle – let us say up to the end of 2021.
You may be dimly aware that electricity generated from so-called renewable sources (mainly wind, solar and hydro) is subsidised. But by how much is it subsidised? And who subsidises it? The Government? Nope.
You know who pays. You do, obviously.
Perhaps you think it’s worth paying a premium on your energy bill for the sake of saving the planet. Perhaps you don’t. Perhaps you think the planet does not really need saving. That’s another matter, which I may address in later posts. This post is simply about the mechanisms by which the renewables subsidies are enacted, and, most importantly, how big these subsidies are in money terms.
The Non-Fossil Fuel Obligation (NFFO)
If you want to start with ancient history, specifically the period 1990 to 2002, then the first subsidy to renewables was via the Non-Fossil Fuel Obligation (NFFO). When the electricity generating monopoly of the Central Electricity Generating Board (CEGB) was broken up and mostly privatised in the early 1990s, it was realised that this was not so easy to accomplish for the nuclear generation component. This was a significant issue because nuclear was a large proportion of total electricity generation (peaking at 27% in the mid-1990s). A mechanism had to be found to support nuclear generation when separated from conventional generation. To quote Mitchell (2005),
“The Competition Directive required that the government obtain permission from the European Commission (EC) for a levy to pay for nuclear power. This they did, but they asked the Commission to accept a levy to pay for non-fossil generation, specifically not mentioning nuclear power…..Thus, from the government’s perspective, renewables were supported in the privatization process as a result of, and linked to, the need to support nuclear power.”
The NFFO paid a subsidy to non-fossil fuel generators, both renewables and nuclear, which peaked in 1991 at £87.8 per MWhr and fell to £27.1 per MWhr by 1998. This was funded by a levy on fossil fuel generators (the Fossil Fuel Levy) which peaked at 11% in 1991 and was less than 1% by 1998, eventually reaching zero in 2002.
(Aside: When the nuclear generator, British Energy, was privatised in 1996, the Fossil Fuel Levy was only 3.7%. Contrary to popular belief, nuclear power, i.e., British Energy, had no subsidy at all by 2002 – the year in which the company became obliged to approach Government for assistance to avoid insolvency, but that’s a story for another post).
In 2002, when the NFFO finally vanished completely it was effectively replaced by the Renewables Obligation. But there was one huge difference: whilst nuclear power was the prime beneficiary of, and the main motivation for, the NFFO, in sharp contrast nuclear power was not eligible for the subsidies under the Renewables Obligation.
It is worth pausing to dwell on this a little. The ostensible reason for encouraging renewables via subsidies was climate change, specifically carbon emissions – often emotionally expressed by labelling renewables as “clean energy” (as opposed, one presumes, from other sources of generation which one is subliminally invited to consider “unclean”). Yet despite nuclear generation being indisputably an extremely low carbon emitter, in 2002 nuclear became officially “unclean”. 2002 was a watershed year; it marks the point at which the nuclear-phobic environmental lobby won big – establishing a puissant mechanism for coercing the expansion of renewables, via the Renewables Obligation, whilst simultaneously denying the same financial support to nuclear power, to which, logically, it should have been entitled on the same basis. However, I digress.
The Renewables Obligation
Starting in 2002, the Renewables Obligation (RO) functioned as an effective stimulus to promote the building of renewable energy sources. The wind turbines and photovoltaics you see everywhere now owe their existence to the RO. Without the RO, or some equivalent financial incentive, renewables would still be a negligible proportion of our total generation.
The RO remained open for new entrants until March 2017, after which it was replaced by Contracts For Differences, of which more later. However, it is important to note that the financial incentives of the RO remain in place for all generators already accredited into the scheme before March 2017, and this will continue to be the case until 2037. Consequently the RO will remain a major source of subsidy for renewables for the next 15 years.
The RO Mechanism
The RO relates to large scale generators. (Small renewable generators, e.g., domestic PV installations, are supported via the feed-in tariff). In the explanation which follows please bear in mind the crucial difference between generators and suppliers. Generators sell power to suppliers in a wholesale market, whilst suppliers then sell the power to end users.
- The RO requires licensed UK electricity suppliers to source a specified proportion of the electricity they provide to customers from eligible renewable sources. This is a Government-imposed obligation upon electricity suppliers. It is expressed as a percentage of the total generation supplied by that supplier.
- The level of Obligation is shown against year in Table 1, rising from 3% at the start of the scheme in 2002 to a peak of 49.2% by 2021/22.
- The mechanism used to account for renewable generation is the Renewable Obligation Certificate (ROC).
- On a monthly basis, each eligible renewable electricity generator reports to the Office of the Gas and Electricity Markets (Ofgem) the amount of renewable electricity they have generated. Ofgem then issues the electricity generator with ROCs related to the amount of renewable electricity they generated. Note that neither Ofgem nor any other Government body provides any cash to anyone.
- ROCs were initially provided on the basis of 1 ROC per MWhr of renewable electricity. In 2009 this was changed to introduce different degrees of incentive for different renewable sources. The exact figures varied year on year but indicative levels were: off-shore wind was awarded 2 ROCs per MWhr, photovoltaic generation 1.5 ROCs/MWhr, on-shore wind 0.9 ROCs per MWhr, sewage gas sources 0.5 ROCs/MWhr and landfill gas sources 0.25 ROCs/MWhr.
- The Obligation is enacted upon suppliers. Every supplier is obligated to provide to Ofgem a certain number of ROCs. The number of ROCs each supplier must provide to Ofgem is their total electricity supplied in MWhr times the Obligation (i.e., the percentage of supply given in Table 1).
- To obtain ROCs in order to redeem them to Ofgem, suppliers must buy ROCs in a marketplace for which the sellers are the generators. This is the mechanism by which generators obtain their cash subsidy: the money comes from the suppliers.
- If a supplier fails to obtain sufficient ROCs to cover their obligation, then the supplier must pay to Ofgem the “buy-out price” (Table 1) per ROC shortfall.
- Monies are thus collected by Ofgem from suppliers who fail to obtain sufficient ROCs to meet their obligation and so have to resort to buy-outs. This money is returned to suppliers in proportion to the percentage of all ROCs redeemed. Thus, a supplier who contributes 5% of the total ROCs redeemed will get 5% of the funds collected from all buy-outs. Consequently, if the market price of a ROC equalled the buy-out price it would always be advantageous to a supplier to buy ROCs in the market and redeem them, due to the bonus which this later provides. For this reason the market price of ROCs will tend to exceed the buy-out price. The high price of ROCs then encourages generators to generate more from renewables.
- Conversely, if the total renewable generation exceeded the Obligation, there would be a glut of ROCs for sale and their price would fall and would drop to zero once all suppliers had obtained their full Obligation quota. This would be a disincentive to generators to generate any more from renewables – and so is to be avoided. To avoid this situation occurring, the Obligation is set with some “headroom”, i.e., making it (say) 10% larger than the maximum Ofgem anticipate would be generated from renewables. In effect this provides a forcing bias in the direction of increasing renewable generation – the central intent of the scheme. Simply put, the Obligation is always a bit larger than can be achieved.
- The RO increases costs to suppliers because they are obliged to buy ROCS or pay the buy-out rate. Suppliers, therefore, have to pass the extra cost onto customers. The bottom line is that the subsidy to generators to encourage them to build more renewable generation plant ultimately comes from the consumer. Every supplier has the same Obligation, and hence every customer is subject to an “RO surcharge” as a percentage of their bill – though it is not usually expressed in such terms, nor is the amount of the surcharge usually quantified explicitly.
The RO arrangement is not a market. It is a game that generators and suppliers are forced to play by the Government and by primary legislation passed by Parliament. As such it is the overt imposition of political will upon the economy. (I am not suggesting that all such impositions of political will are undesirable, nor that unfettered free markets are always lovely, but one needs to be mindful that the benefits that can accrue from allowing free markets to operate might be circumvented if arbitrary rules are imposed. Where political will is the controlling factor, the wisdom of a policy does not exceed the wisdom of politicians).
So much for the RO mechanism, but how much cash is the RO subsidy to generators worth, and how big is the “RO surcharge” to domestic customers like you and me? (See after the Table).
| Obligation period | % of Supply | Buy Out Price, £ |
| 2002/3 | 3.0 | 30.00 |
| 2003/4 | 4.3 | 30.51 |
| 2004/5 | 4.9 | 31.39 |
| 2005/6 | 5.5 | 32.33 |
| 2006/7 | 6.7 | 33.24 |
| 2007/8 | 7.9 | 34.30 |
| 2008/9 | 9.1 | 35.76 |
| 2009/10 | 9.7 | 37.19 |
| 2010/11 | 11.1 | 36.99 |
| 2011/12 | 12.4 | 38.69 |
| 2012/13 | 15.8 | 40.71 |
| 2013/14 | 20.6 | 42.02 |
| 2014/15 | 24.4 | 43.30 |
| 2015/16 | 29.0 | 44.33 |
| 2016/17 | 34.8 | 44.77 |
| 2017/18 | 40.9 | 45.58 |
| 2018/19 | 46.8 | 47.22 |
| 2019/20 | 48.4 | 48.78 |
| 2020/21 | 47.1 | 50.05 |
| 2021/22 | 49.2 | 50.8 |
| 2022/23 | 49.1 | 52.88 |
Cash Value of the RO Subsidy
To calculate the RO subsidy we need the following inputs,
- The Obligation, as a percentage of supplied electricity;
- The total electricity supplied in the year (in MWhrs);
- The number of ROCs issued by Ofgem in the year;
- The buy-out price per ROC;
- The nominal or average ROC price on the market.
A and D are given in Table 1. The sources I used for these and the other required inputs were: (i) Various data 2002 to 2010; (ii) Various data 2001 to 2021; (iii) 2002 to 2012 traded ROC price; (iv) 2020/21 traded ROC price; (v) total supplied electricity and fraction of domestic consumers.
The subsidy is then found as C*E + (A*B – C)*D. In practice sources may provide the Obligation directly in MWhr terms, i.e., A*B.
The result is an RO subsidy which increased from £0.37B in 2002 to £7.53B in 2021.
Contracts For Differences
Contracts For Differences (CFD) effectively replaced the Renewables Obligation, the timing being such that generating plant with approved CFD started to come on stream in 2017 when RO ceased for new entrants. The motivation for CFD was the same as that for RO: to provide incentives for companies to build new renewable generating capacity by the provision of trading subsidies. However, a further objective was to achieve this end at lower cost, an objective which an evaluation of the scheme in 2019 claimed to have been achieved.
Contracts for Differences work by creating a private contract between the renewable or low-carbon electricity generator and the Low Carbon Contracts Company (LCCC), created for the purpose. I will leave the reader to ponder how a company can be “private” when it was created by political/legislative fiat and was wholly owned initially by the Secretary of State for Energy and Climate Change and now by the Government Department BEIS (Department for Business, Innovation and Skills).
Unlike the Renewables Obligation, nuclear power is eligible for the CFD scheme, as it was prior to 2002 under the NFFO. However, this is academic as the CFD provides subsidy only once the plant is operational, whereas the barrier to new nuclear build is the difficulty in financing the huge up-front capital costs of building and licencing the plant. Consequently, even with CFD available, the potential UK nuclear renaissance which seemed so promising in the period 2013 to 2018 proved to be stillborn when both Hitachi and Toshiba pulled out of the proposed new build at Oldbury, Wylfa and Moorside, wiping nearly 9 GW off the anticipated additional nuclear capacity.
A CFD contract agrees to pay the difference between a ‘strike price’ and the reference price for electricity generated. The reference price is an average market price. The difference between these two prices is paid to the generator as a subsidy. The generator continues to sell electricity into the energy market as usual but also receives this top-up to reach the agreed strike price. If at any time the market price rises above the strike price, the generator must pay back the difference. In effect a CFD provides a chosen renewable generator with a fixed price for their electricity, and this fixed price will be above the projected average market price.
Generators have to bid for these contracts against a fixed LCCC budget, and a key part of their bid is their requested strike price. In essence the reasoning is that renewable generators will be in competition with each other to offer a lower strike price in order to win the contract. Auctions for these CFD contracts were initially held every few years (now annually) and are applicable to new renewables which are planned, i.e., not existing renewables which are already covered by the RO. As I write there have been five tranches of CFD contract awards.
So who pays? You know who. Quote,
“This top-up amount (i.e., paid to generators) is then charged as a levy on electricity suppliers under the Contracts for Difference (Electricity Supplier Obligation) Regulations 2014. The payment of the top-up amount and the levy on electricity suppliers is managed by the Low Carbon Contracts Company.”
The suppliers are charged directly, but as with the other incentive schemes they will then simply pass the additional cost onto the consumer (business or domestic).
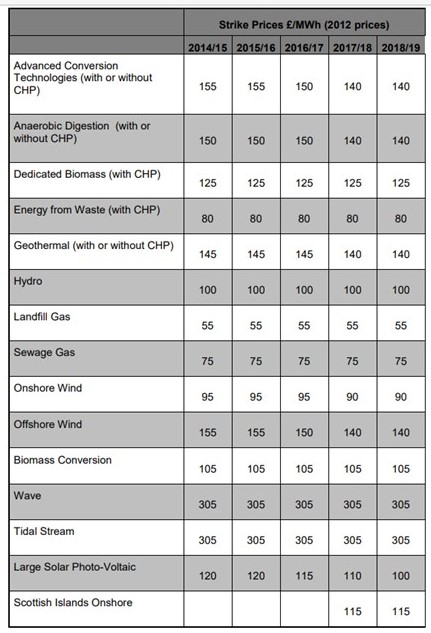
Incidentally it is instructive to peruse the strike price agreed for the initial tranche of CFD contracts, applicable 2014 to 2019 (Table 2). Compare these with the strike price agreed for the new nuclear station now being built at Hinkley Point C, namely £92.5 per MWhr. There was a storm of protest in the press at this ostensibly exorbitant price. Yet Table 2 shows the same strike price for on-shore wind, and far higher strike prices for all but a couple of the other renewable sources. The weighted average strike price in this first allocation of CFD contracts was £102 per MWhr.
However, strike prices in recent auctions have reduced. By the second allocation of contracts, for generation coming on-stream from 2021 to 2023, the average strike price had dropped to £62.6 per MWhr. In later allocations the strike price for on-shore wind has reduced markedly, and even off-shore strike prices look to fall below Hinkley Point’s by 2027. However, hydro remains comparable with Hinkley Point C, whilst wave power, tidal power, geothermal and many other renewable sources continue to have far higher strike prices than Hinkley Point C.
To estimate the subsidy provided by the CFD scheme the following inputs are required: (i) the strike price for each contract, (ii) the wholesale electricity price, averaged over the period in question; (iii) the installed capacity and average load factor for each of the contracts. A detailed breakdown of the strike prices and installed capacity for every contract awarded under allocations 1, 2, 3 and 4 have been published.
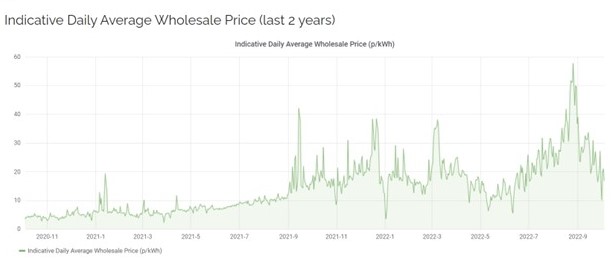
The wholesale price of electricity is the price suppliers buy the power from generators. It is a far lower price than is paid by consumers and has varied enormously over the last two years (see Figure 1). At the end of 2020 the wholesale price was around 5 p/kWhr (£50 /MWhr). By mid-summer 2021 it had risen to 10 p/kWhr (£100 /MWhr), and in September 2021 rose steeply and became highly variable, averaging around 20 p/kWhr (£200 /MWhr).
(Incidentally, people who still think that the Russian invasion of Ukraine was solely responsible for the recent huge hike in energy prices need to look carefully at Figure 1. Much of the increase had already occurred by September 2021 – the invasion, of course, started on 24th February 2022).
Load factors for renewables generating plant are woeful (I’ll give details in a subsequent post). A generous assumption is 25%. Using this together with an assumed wholesale price of 4 p/kWhr (£40 per MWhr) in 2019 and 2021 indicates a total subsidy arising from CFD contracts crudely of the order of £300M per year. This is confirmed by the published budget estimates. Only allocations 1 and 2 are relevant so far, subsequent allocations relating to generation in 2023 and later. Budgets were negligible before 2018, and in the four years 2018 to 2021 the estimated budgets were £87M, £283M, £337M and £171M respectively. These sums are very small compared with the RO subsidies (which still operate, please recall) but have been added to the total estimated herein for these years.
The Climate Change Levy and Carbon Price Support
These are taxes and hence are collected by the HMRC as income to the Exchequer.
These taxes are not payable by domestic consumers, only business consumers.
The Climate Change Levy is collected from business customers by suppliers of the following commodities : electricity, gas, coal or coke, LPG or other hydrocarbons in liquid form. As an example, electricity is taxed at a rate of £7.75 to £8.47 per MWhr in recent years. Note that this is a levy on all electricity, irrespective of source (whether fossil fuel, nuclear or renewable). Note also that it is businesses that pay; electricity suppliers merely act as the HMRC’s collecting agent (similar to VAT). The Climate Change Levy has been in force since 2001.
The Carbon Price Support is a tax paid by electricity generators based on their usage of gas, coal or liquid hydrocarbons. For example, the rate for gas is £3.3 per MWhr at present. The Carbon Price Support came into force in 2013.
Although domestic consumers do not pay these taxes directly it would be naïve to assume that electricity generators do not pass on the cost of Carbon Price Support to suppliers via the wholesale price, and that suppliers do not then pass on this cost to all customers. Similarly, whilst the Climate Change Levy is paid by businesses who purchase eligible commodities, it can be assumed that an end consumer of the business’s products will ultimately pay via higher prices.
Consequently I have added allowances for these taxes on the total burden to the consumer, albeit they will not feature explicitly on domestic energy bills.
The Climate Change Levy peaked at £1.55B in 2008 and was £0.82B in 2021. The Carbon Price Support was £0.79B in 2013 when it was introduced and fell to £0.56B in 2021.
The (Other) “Green Levies”
Ofgem, the gas and electricity regulator, calls the remaining “green levies” a “social and environmental obligation” which is used to pay for government energy policies. Students of Klaus Schwab and the WEF’s Great Reset – or simply people who know how hedge funds and other large lenders have been behaving recently – will be familiar with ESG: Environmental, Social and Governance rating – a social credit score for businesses.
These remaining “Green Levies” include funding for energy efficiency schemes such as the Energy Company Obligation (ECO),which includes the Home Heating Cost Reduction scheme, and the Local Authority Flex scheme (LA Flex). It also pays for Government grants to households to improve their homes’ insulation and boiler upgrades, and it finances the Warm Home Discount scheme. The Green Levies also include financing the Feed-In Tariff (e.g., for domestic PV installations) and the EU Emissions Trading Scheme. Financing the installation of smart meters is also under the Green Levies, as are the Domestic Renewable Heat Incentive, the Renewables Energy Guarantee Origin (REGO), the Smart Export Guarantee, and the Renewables and CHP Register.
The message here is that a plethora of Government initiatives are actually being funded via your energy bills, rather than by taxes. To put that another way, your energy bill is being used as a stealth tax.
But what do these add to the average domestic bill? Throw-away remarks abound in news reports, typically “Green levies make up around 8 per cent of our energy bills, or 12 per cent if you include social policies”. The key here is the word “energy”, not “electricity”. As we shall see, the total “green” levies (subsidies) on electricity are far larger.
It is difficult to discover the total cost of all these additional “green levies”, or even the cost of any one of them. To cut through this uncertainty I shall allow a total of £70 on domestic bills to account for them in 2021 (and half that level in 2010).
And the total is…
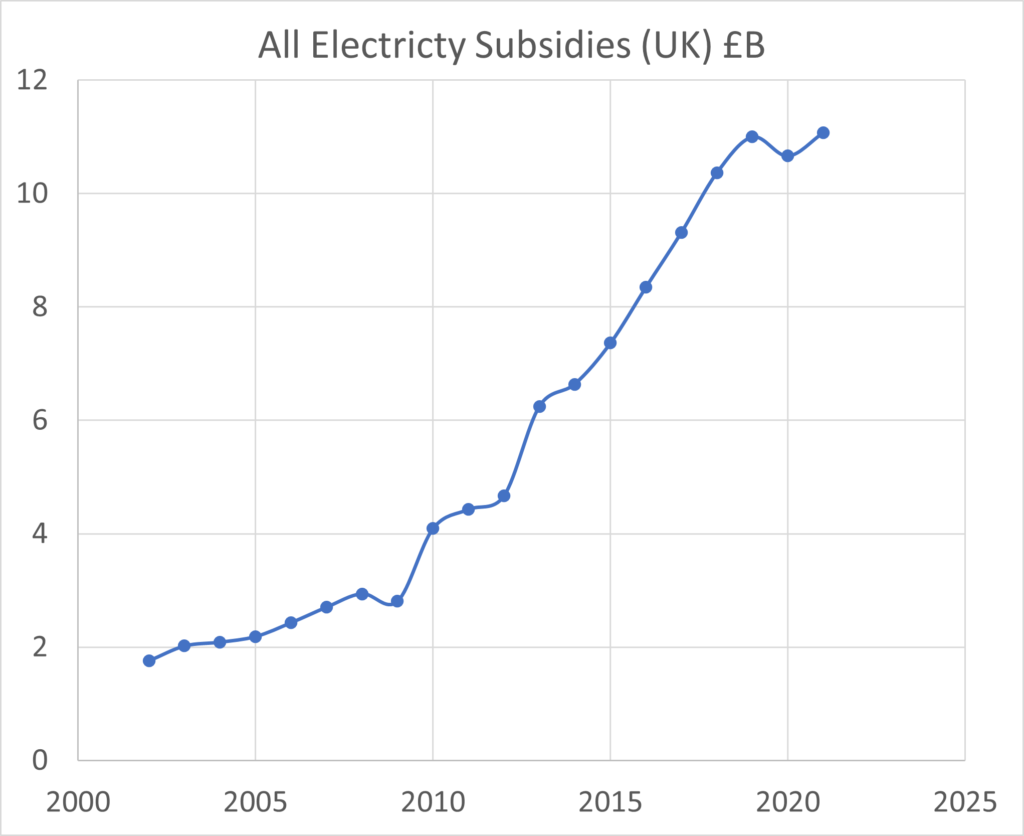
Adding all the foregoing components of subsidy gives the total as plotted in Figure 2. In 2019 to 2021 it has been £11B per year.
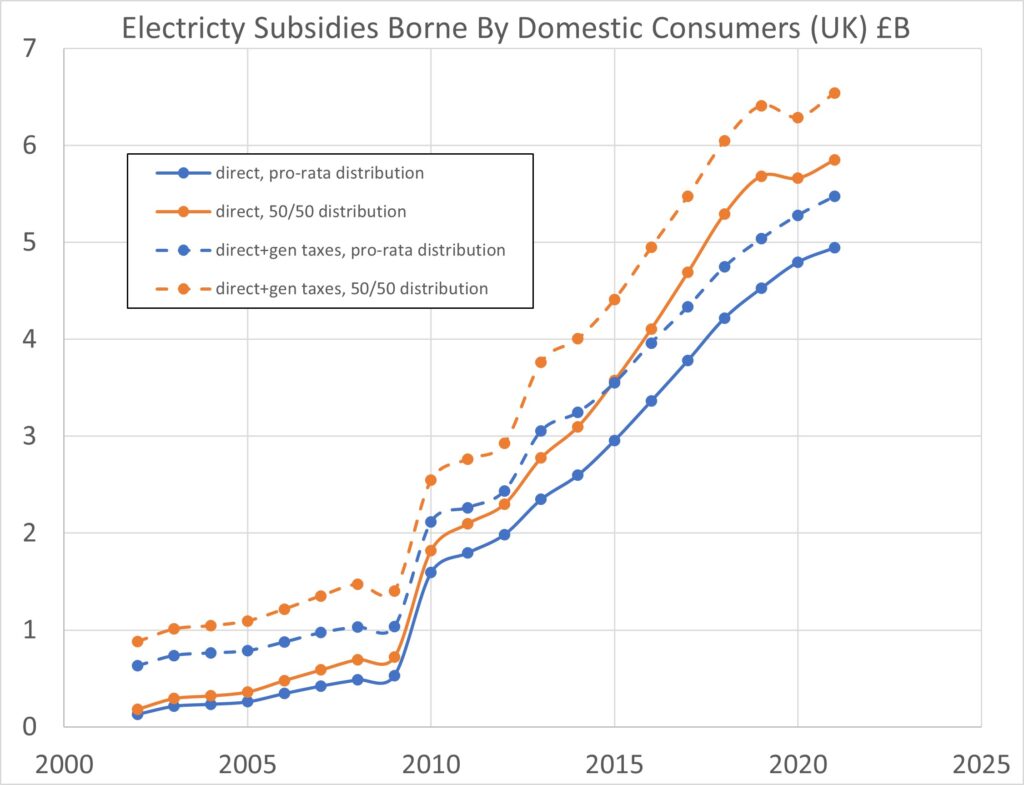
Figure 3 plots the component of this total subsidy which is paid by domestic consumers. Here there is ambiguity because suppliers need not recharge these costs equally to domestic and business customers. One would expect that they would not. The reason is that suppliers are very keen to agree forward contracts with large business customers, who can therefore drive a hard bargain. To be competitive and win these desirable large contracts, suppliers can opt to burden domestic customers disproportionately with these subsidy costs. In Figure 3 I have plotted two options: (i) costs distributed pro-rata, i.e., equitably according to power delivered, and, (ii) costs distributed 50/50 to domestic and business customers. The latter burdens domestic customers disproportionately because they actually account for only 38% of total supplied electricity. Figure 3 plots the subsidies borne by domestic customers both including the “taxed” components (the Climate Change Levy and the Carbon Price Support) and without these items.
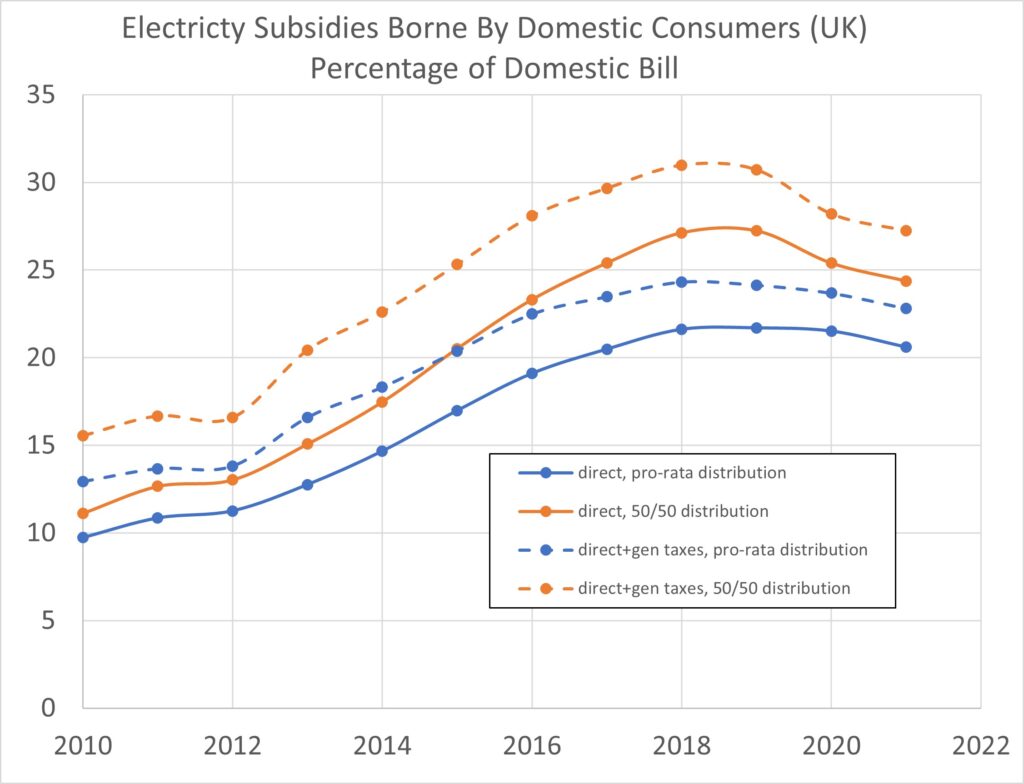
Figure 4 is as Figure 3 but expressed as a percentage of individuals’ domestic electricity bills. (Note that this is NOT the same as the percentage of a combined gas and electricity bill, as the subsidies affect electricity far more than gas).
The subsidy peaked in 2018 at between 21.6% and 31.0% of domestic electricity bills.
This does not include VAT which is charged at 5% for domestic energy (20% for business customers). Including subsidies and all tax elements, the burden on domestic consumers peaked in 2018 at between 29.3% and 36.0% of their electricity bills.
2022 Onwards
The total cost of subsidies, shown in Figures 2 and 3, will remain roughly right. But the huge price increases in 2022 will mean that, when expressed in percentage terms, these subsidies will be a smaller percentage than indicated by Figure 4.
Credibility Check: Ofgem’s Analysis
Ofgem has usefully provided a breakdown of domestic energy bills in 2020. They did so separately for electricity, gas and dual fuel tariffs. (If you get both your electricity and gas from the same supplier then you are almost certainly on a dual fuel tariff). The total Environmental and Social Obligation costs were 25.5% of a bill for electricity alone. The percentage impact on a gas bill is far smaller, because by far the largest subsidy, the Renewables Obligation, relates only to electricity. For a dual fuel tariff the total Environmental and Social Obligation costs were, in percentage terms, between the two, not surprisingly. However, in this post we are concerned with your electricity bill and the proportion of it which pays for subsidies (or taxes). Hence Ofgem’s 25.5% figure is to be compared with Figure 4. It lies central to my range of estimates.
New Nuclear Support
In October 2021, the BEIS under Minister of State Kwasi Kwarteng (now Chancellor of the Exchequer) proposed a new financing model for new nuclear build, culminating in the Nuclear Energy (Financing) Bill 2021-22, which is based on a model known as the Regulated Asset Base (RAB) model. This Act recognised that the CFD model had failed in the case of nuclear build. The CFD model provides no support prior to the plant generating electricty. This is acceptable to generating companies where the capital cost of the new build is relatively small (e.g., wind turbines and PV installations), but fails to overcome the primary barrier to new nuclear build which is the huge up-front capital costs of building the plant. The proposed EPR at Sizewell C will be funded under the RAB model. More of this in a future post. For now I merely note that these new RAB-based arrangements have not yet impacted on your electricity bills.
One response to “Subsidies to Renewables: Who Pays and How Much?”
Please subscribe me