In Fracking Part 1 I concluded with the observation that fracking of inland oil or gas wells had been banned in the UK after an exploratory well in Lancashire gave rise to seismic events up to magnitude 2.3, a magnitude of seismic event that occurs 160 times per year in the UK. That hardly seems an adequate basis for banning a technology that could be of huge benefit to the country. So, as we all currently shiver in sub-zero temperatures despite our gas bills being three times what they were last year, I take a closer look at the association between fracking and earthquakes in this post. To do so I consider the USA where fracking of wells is extremely widespread over many States.
There is nothing new about inland gas wells in the USA, at least 35 States have some, and generally have had for 40 years or far longer. The number of gas producing wells in the USA peaked at 586,213 in 2014 and is now fewer than 480,000. The State with by far the largest number of gas wells is Texas with 118,957 wells in 2020. The next five largest States in terms of total gas production wells are Pennsylvania (68,929), West Virginia (47,934), Oklahoma (40,360), New Mexico (32,529) and Colorado (31,939), figures as of 2020, these data taken from https://www.eia.gov/dnav/ng/ng_prod_wells_s1_a.htm.
However, most of these are not, or were not, fracked wells. Fracking was used in the USA from the 1940s but started to be used in a widespread manner only after 2009. Fracking operations are not a frequent event even for a fracking well. Once successfully fracked, which typically takes just a few days, the well will produce gas for years or decades, and perhaps one fracking event will be sufficient for its productive life.
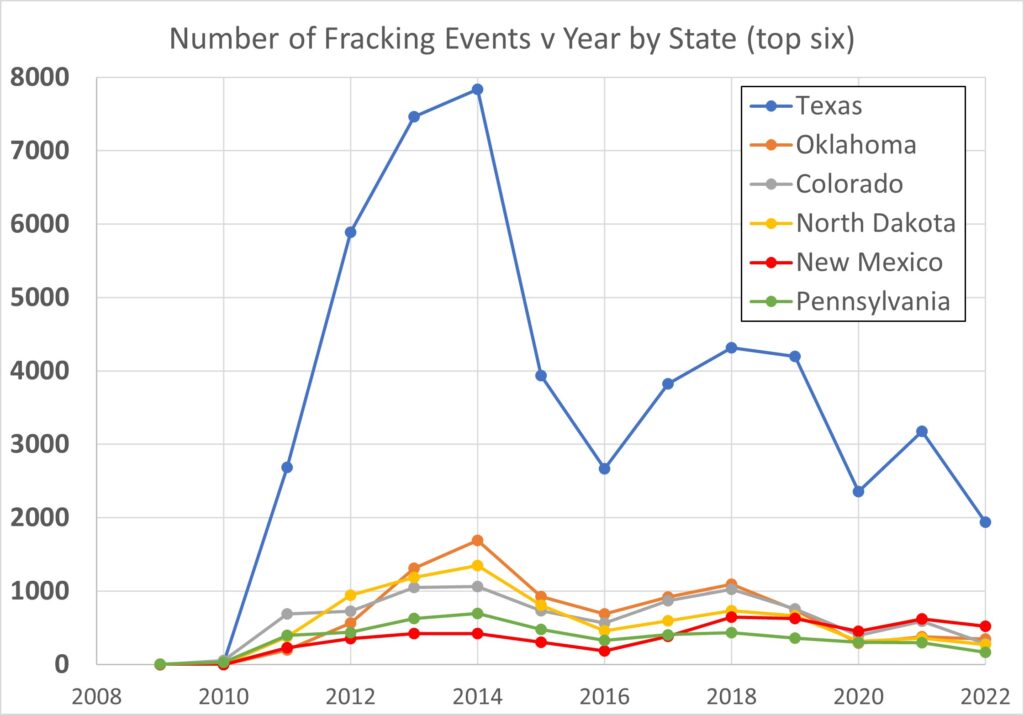
Again the State with by far the largest number of fracking events is Texas, with 50,308 to date. The next six States in terms of the largest number of fracking events over life are Oklahoma (9,165), Colorado (8,803), North Dakota (8,076), New Mexico (5,171) and Pennsylvania (4,968). These data are to 30 November 2022 and were taken from https://www.fracfocus.org
The FracFocus site provides downloadable csv files. As of 9/12/22 there were 24 files with 250,000 rows of data each, making 6 million records in all. However, the same fracking event – typically spread over two to five days – generates many records, one for each chemical ingredient in the fracking fluid. There are also two smaller files with 100,000 rows of data each, plus a small file with a few hundred lines of data, these called registryupload_1 (2 or 3). These have just one row per fracking event. These have been used to derive the fracking event data used herein. By searching these three files the number of fracking events per State per year was found. For the top six States in terms of numbers of fracking events, Figure 1 plots the number of such events per year from 2009.
Figure 1 shows the extent of Texas’s dominance over the other States as regards fracking (as indeed it is for all gas wells).
I have obtained data on earthquakes from USGS Earthquake Hazards Program. This permits searching earthquakes by magnitude range and by time period, for any rectangular region specified on a map of the USA. I have obtain all the seismic events with magnitudes from 2 to 10 from 1978 to 30th November 2022, for each of the six States plotted in Figure 1, i.e., those States with the largest number of fracking events. The search facility is here.
The earthquake events were found in six 0.5 magnitude range from 2 to 5, plus a single range from 5 to 10. Before looking at the data it is worth considering what these (Richter) magnitudes mean. This is illustrated by Table 1. The salient point is that below magnitude 5 an earthquake is very unlikely to cause damage, though between 4.5 and 5 an earthquake may cause “minimal damage”. Events up to magnitude 3 are essentially “non-events”, and even events up to magnitude 4 are sufficiently minor that they may not be felt by some people.
| Magnitude | Description | Typical Effects | Indicative Frequency |
| 2.0–2.9 | Minor | Felt slightly by some people. No damage to buildings. | Over one million per year |
| 3.0–3.9 | Minor | Often felt by people, but very rarely causes damage. Shaking of indoor objects can be noticeable. | Over 100,000 per year |
| 4.0–4.9 | Light | Noticeable shaking of indoor objects and rattling noises. Felt by most people in the affected area. Slightly felt outside. Generally causes zero to minimal damage. Moderate to significant damage very unlikely. Some objects may fall off shelves or be knocked over. | 10,000 to 15,000 per year |
| 5.0–5.9 | Moderate | Can cause damage of varying severity to poorly constructed buildings. Zero to slight damage to all other buildings. Felt by everyone. | 1,000 to 1,500 per year |
The results are discussed Sate by State.
Oklahoma
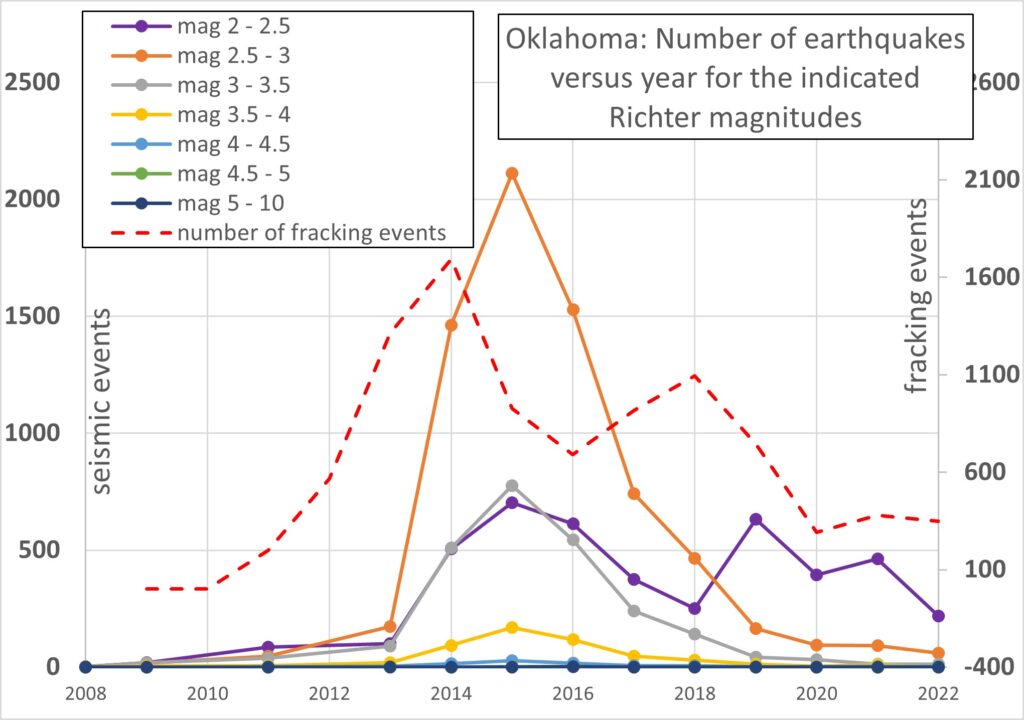
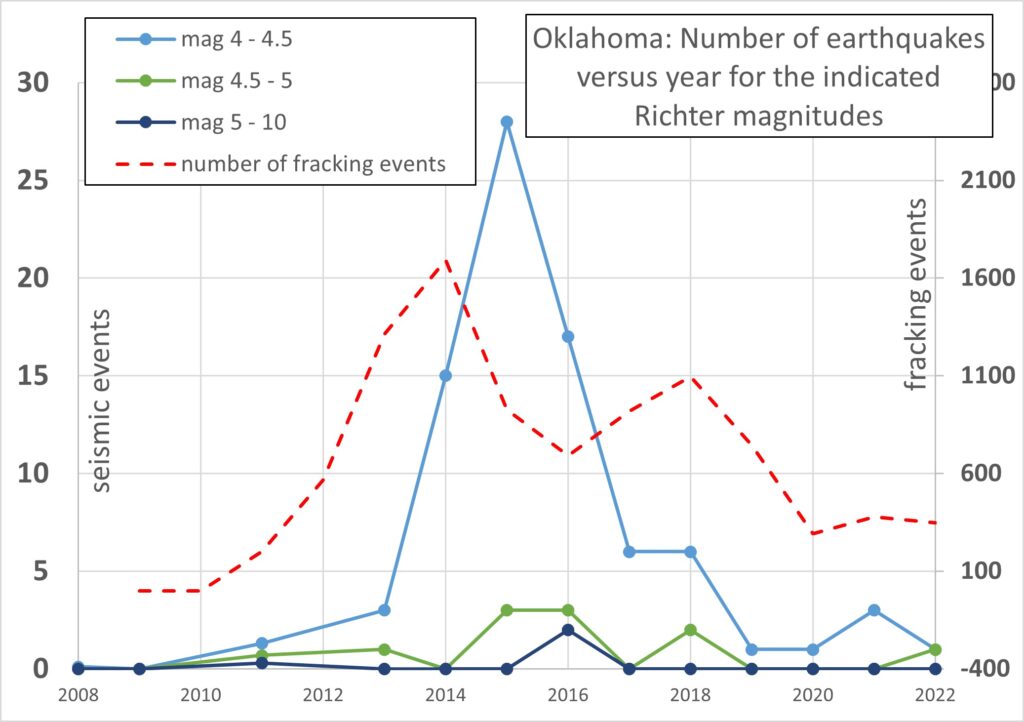
It was Oklahoma that first raised the alarm that fracking (or wells associated with fracking) might be causing earthquakes. Figure 2a plots the number of seismic events against year by magnitude range. For comparison the number of fracking events in Oklahoma are also plotted, by year, in Figure 2a. Figure 2b is the same but showing only the higher magnitudes, 4 and above, on an expanded scale.
The data plotted as year 2008 are actually the average of the 30 years from 1978 to 2008, and this applies throughout the rest of this article. (Due weighting is applied when calculating correlations, below).
There is a very marked increase in the frequency of seismic events of magnitude less than 4.5 when fracking takes off in Oklahoma. Moreover, the frequency of minor earthquakes reduces again when the frequency of fracking reduces.
Table 2 shows the Pearson correlations (r) between the two events (seismic and fracking), for each seismic magnitude range. The correlations up to magnitude 5 are large and statistically significant (p < 0.05), confirming one’s qualitative observations from Figures 2a,b.
The correlation for magnitudes greater than 5 is not statistically significant. However, there were three events of magnitude greater than 5 (at 5.1, 5.7 and 5.8) and all occurred after the start of fracking. This is salutary, though it may be a fluke.
On the plus side, by 2022 the number of earthquakes had reduced to a very small proportion of its peak, perhaps indicating that much of the propensity of these wells to produce earthquakes can be ameliorated by better management, rather than being intrinsic to fracking. However, seismicity remains higher than it was pre-fracking.
| Magnitude Range | Ok | Ok | Col | Col | NM | NM |
| r | p | r | p | r | p | |
| 2.0 – 2.5 | 0.71 | 2.E-05 | 0.65 | 2.E-04 | 0.40 | 4.E-02 |
| 2.5 – 3.0 | 0.69 | 4.E-05 | 0.70 | 4.E-05 | 0.62 | 4.E-04 |
| 3.0 – 3.5 | 0.68 | 6.E-05 | 0.43 | 2.E-02 | ||
| 3.5 – 4.0 | 0.66 | 1.E-04 | 0.48 | 1.E-02 | ||
| 4.0 – 4.5 | 0.66 | 2.E-04 | ||||
| 4.5 – 5.0 | 0.48 | 1.E-02 | -0.52 | 5.E-03 | -0.81 | 2.E-07 |
| 5.0 – 10 | ||||||
| under 3 | 0.73 | 9.E-06 | 0.76 | 5.E-06 | 0.54 | 3.E-03 |
| under 4 | 0.72 | 1.E-05 | 0.74 | 9.E-06 | 0.55 | 3.E-03 |
| under 5 | 0.72 | 1.E-05 | 0.74 | 8.E-06 | 0.54 | 3.E-03 |
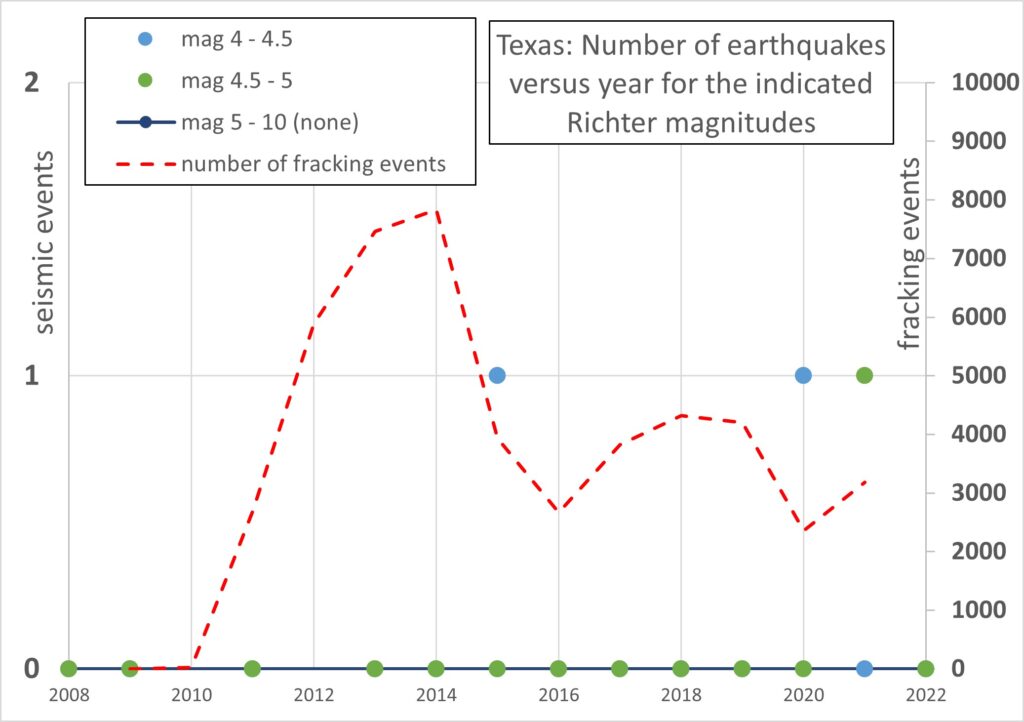
Texas
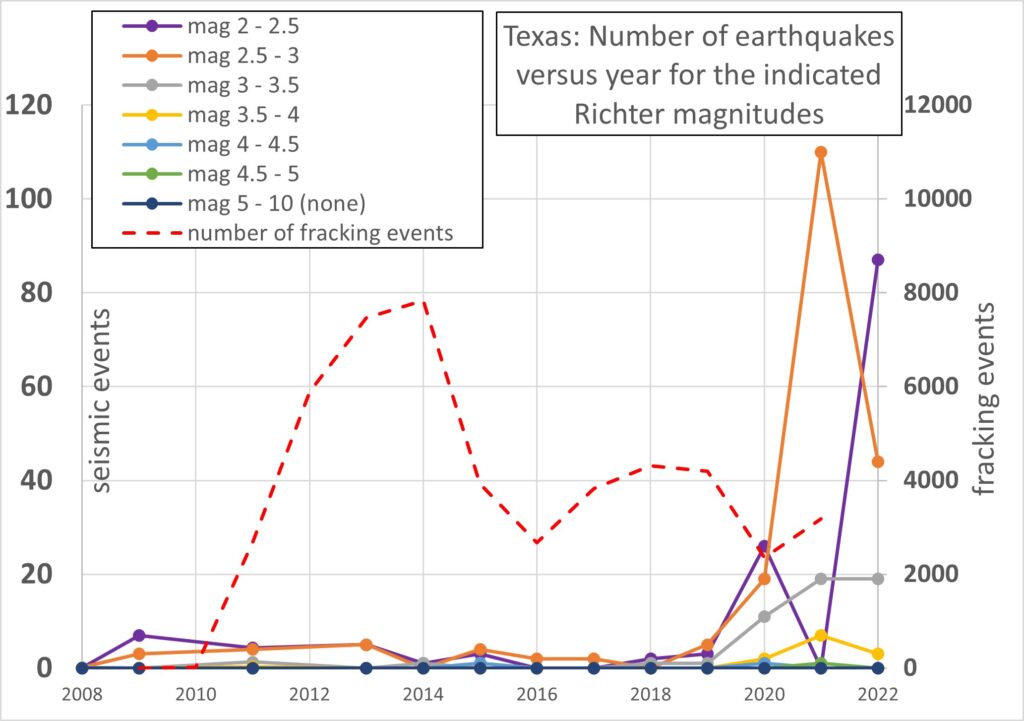
Figure 3a plots the number of seismic events against year by magnitude range in comparison with the number of fracking events in Texas. Figure 3b is the same but showing only the higher magnitudes, 4 and above, on an expanded scale.
In contrast to Oklahoma, there is no obvious association between seismic events and fracking events. This is confirmed by the absence of any statistically significant correlations, for any seismic magnitude.
However, Figure 3a indicates a marked increase in the number of earthquakes at magnitudes below 4 in the period 2020 to 2022. That this coincides with Covid lockdowns and associated effects may not be coincidence. Gas demand was much reduced during this period, and many wells stopped production. It is possible that advantage was taken of this quiet time, in terms of production, to dispose of waste waters underground. This is standard practice for certain “injection wells”, and this process of pumping water under pressure into underground cavities has been claimed by some to be the primary cause of earthquakes, rather than fracking per se. However, this is speculation on my part.
What the Texan data does show, however, is that there may be no necessary connection between fracking operations and earthquakes, but rather such propensity can be managed away. The Texan experience is especially important given the dominance of Texas in respect of both gas production generally and fracking in particular (see above).
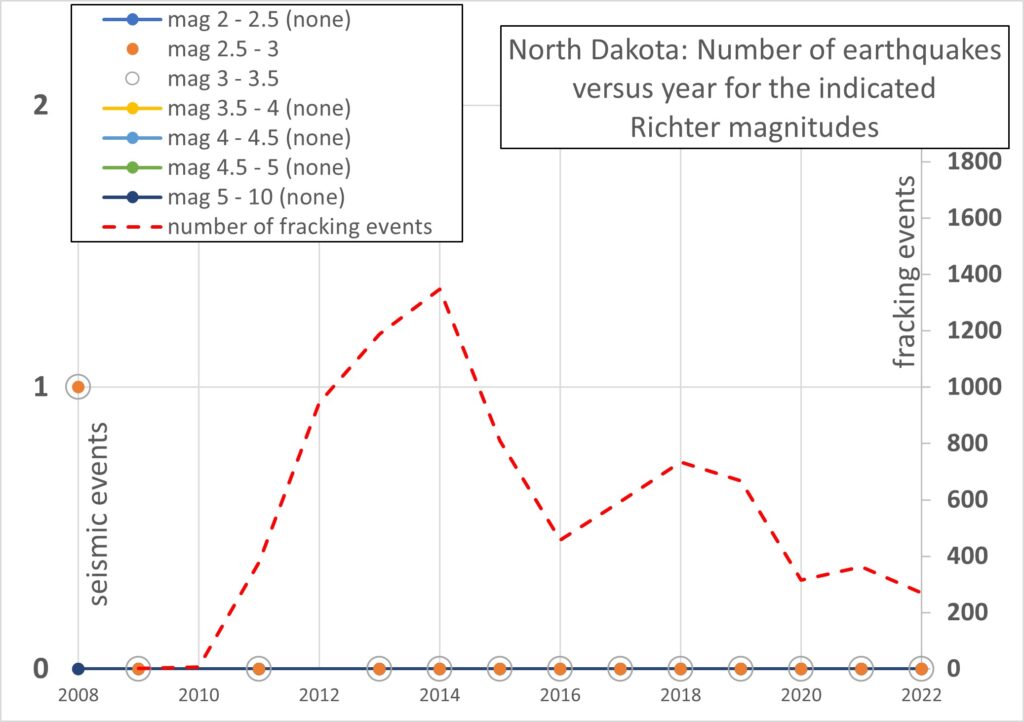
North Dakota
North Dakota has seen 8,076 fracking events since 2009, see Figure 4. However, the State is remarkably quiescent in terms of seismic activity. There were just two events in the pre-fracking period 1978 – 2008 (magnitudes between 2.5 and 3.5), but no events at all during the fracking period (2009 to 2022).
Obviously, locally geology will play a dominant role in the difference between States. But North Dakota does seem to suggest that fracking, or its associated gas well activity, does not cause earthquakes if the geology is itself benign.
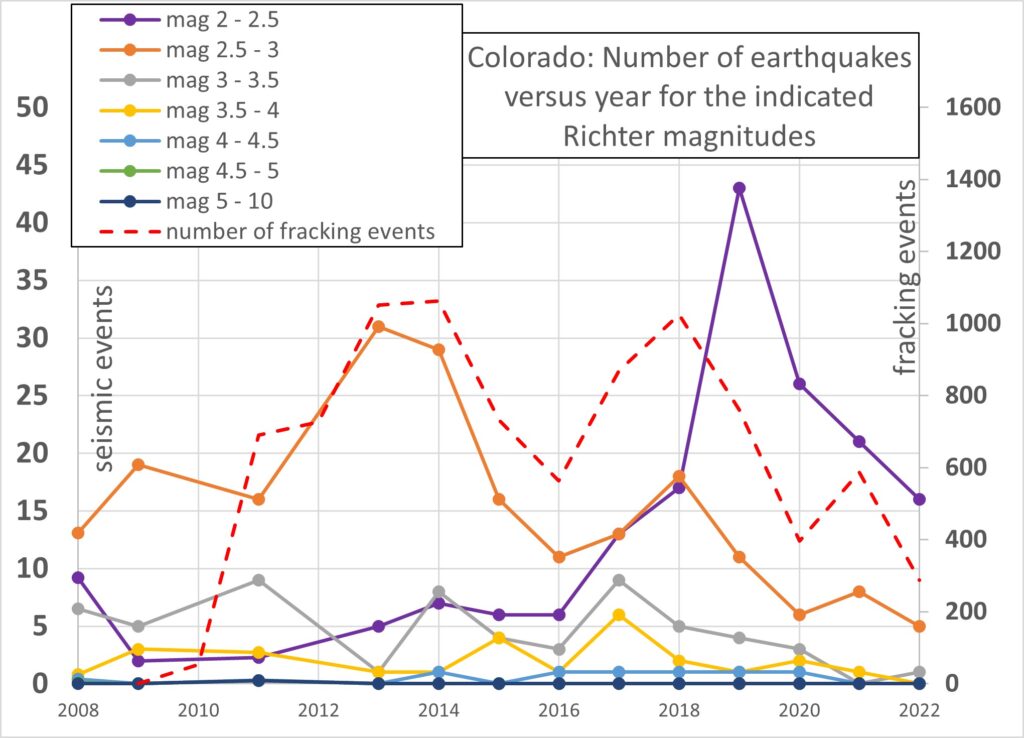
Colorado
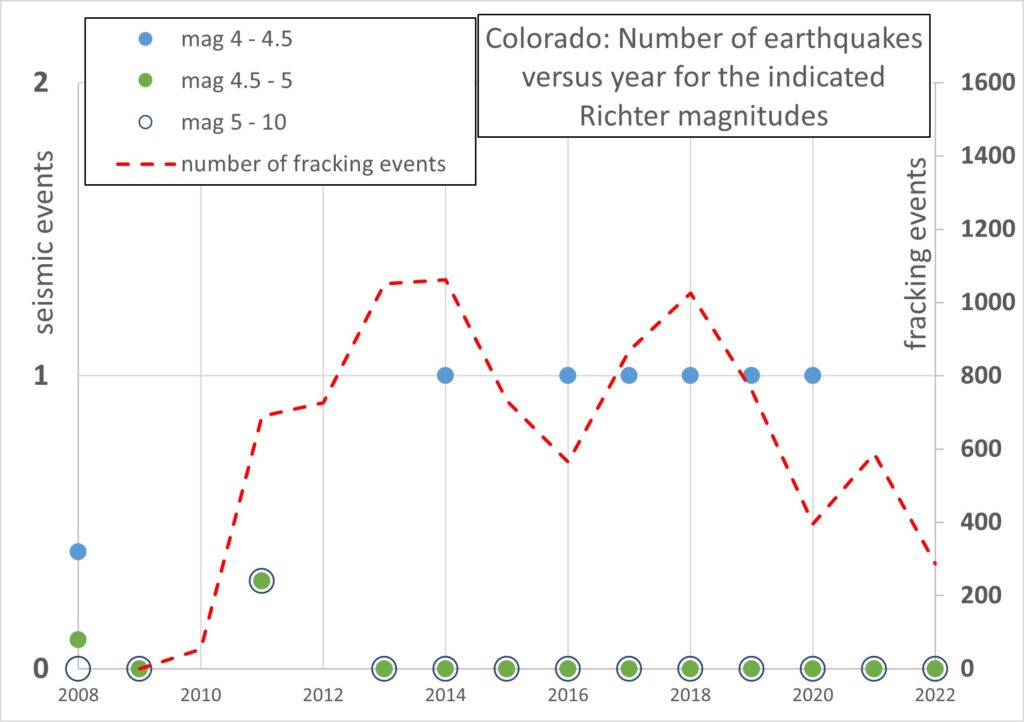
Figure 5a plots the number of seismic events against year by magnitude range in comparison with the number of fracking events in Colorado. Figure 5b is the same but showing only the higher magnitudes, 4 and above, on an expanded scale.
Table 2 shows there are large and statistically significant correlations between fracking events and seismic events up to magnitude 4. This confirms what inspection of Figure 3a suggests.
There is no significant association above magnitude 4, despite the appearance of Figure 5b. There were 6 events between magnitudes 4 and 4.5 since fracking began, but 12 such events in the 30 years before fracking.
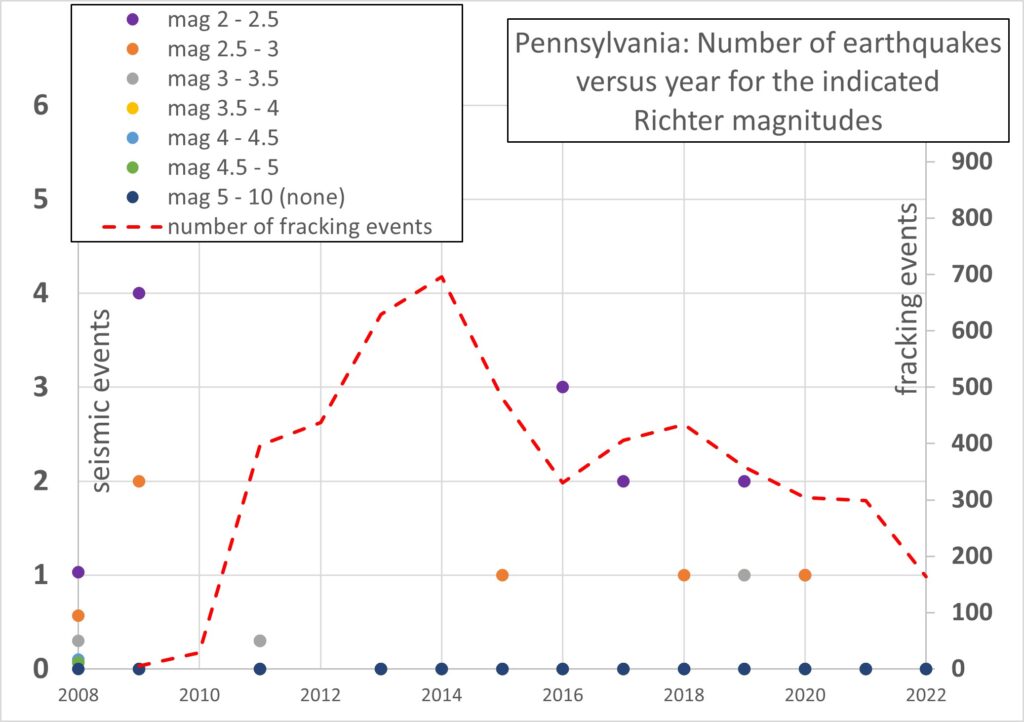
Pennsylvania
Pennsylvania is another very quiet State seismically. Figure 6 plots the number of seismic events against year by magnitude range in comparison with the number of fracking events in Pennsylvania. The number of earthquakes is sparse and there is no obvious relationship with fracking. This is confirmed by the absence of any statistically significant correlations.
There have been 5 seismic events of magnitude greater than 4.5 since 1978, but all 5 were before fracking started.
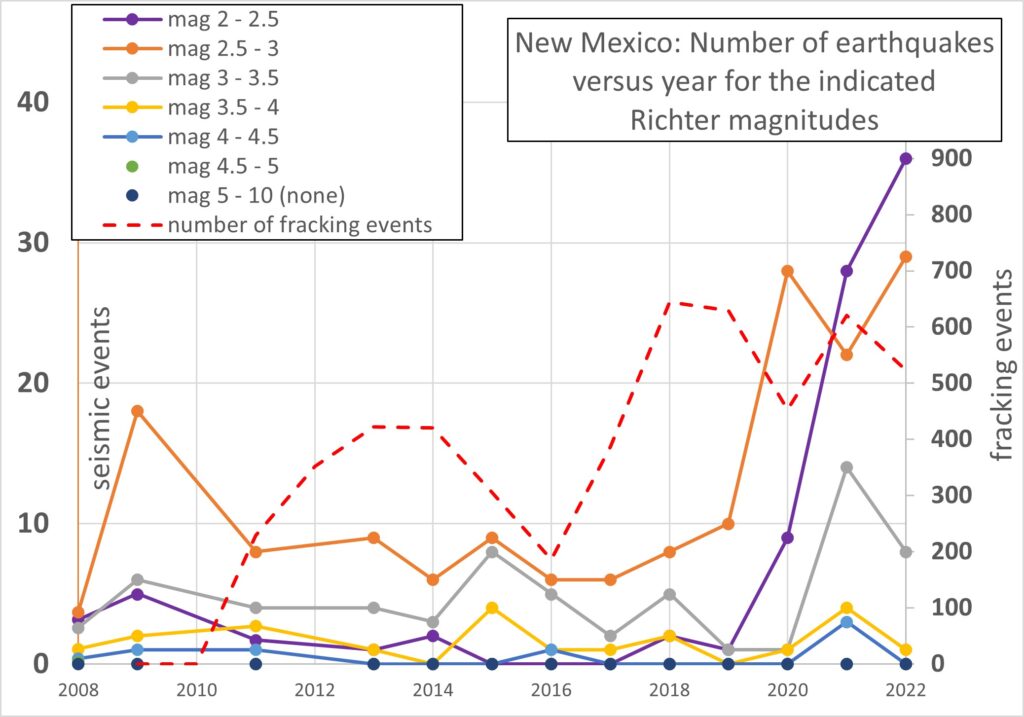
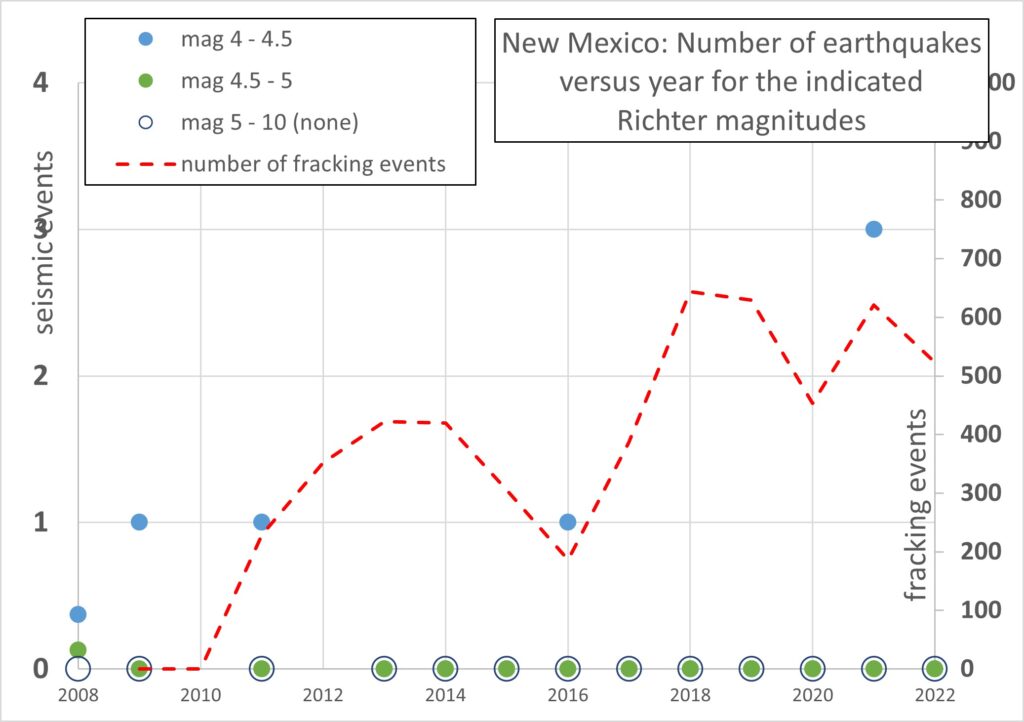
New Mexico
Figure 7a plots the number of seismic events against year by magnitude range in comparison with the number of fracking events in New Mexico. Figure 7b is the same but showing only the higher magnitudes, 4 and above, on an expanded scale.
Inspection of Figure 7a shows a clear association between fracking events and seismic events at the lower magnitudes. This is confirmed by Table 2 which indicates large and statistically significant correlations up to magnitude 3.5.
Conclusion
The potential association between fracking activities and seismic events has been investigated for the six States of the USA which have had the largest number of fracking events.
Three States, Texas, North Dakota and Pennsylvania, exhibit no such association. One of these (Texas) has enhanced seismic activity in the last three years for reasons unknown.
The other three States, Oklahoma, Colorado and New Mexico, all exhibit statistically significant correlations between numbers of fracking events per year and number of seismic events in the same year, for the lower magnitudes of earthquake.
For New Mexico significance extends to magnitude 3.5, for Colorado to magnitude 4, and for Oklahoma to magnitude 5.
The data suggests that seismic implications of fracked gas wells may be ameliorated by better management and perhaps by tighter legislative control. However, a dominant feature which has not been explored here is the significance of local geology which likely explains why some States have a benign response even to very widespread fracking.